My Role
Product Design Lead for the entire project, including design strategy, research, design and execution.
Collaborators:
1 Product Manager
1 Product Designer
1 UX Researcher
3 Backend Developers
2 Frontend Developers
2 QAs
design Challenges
1. No other designers could solve the drop-off locations design problem for 8 months due to its complexity
2. Large ecosystem, there're 5 platforms involves in this project
3. Lacking product knowledge
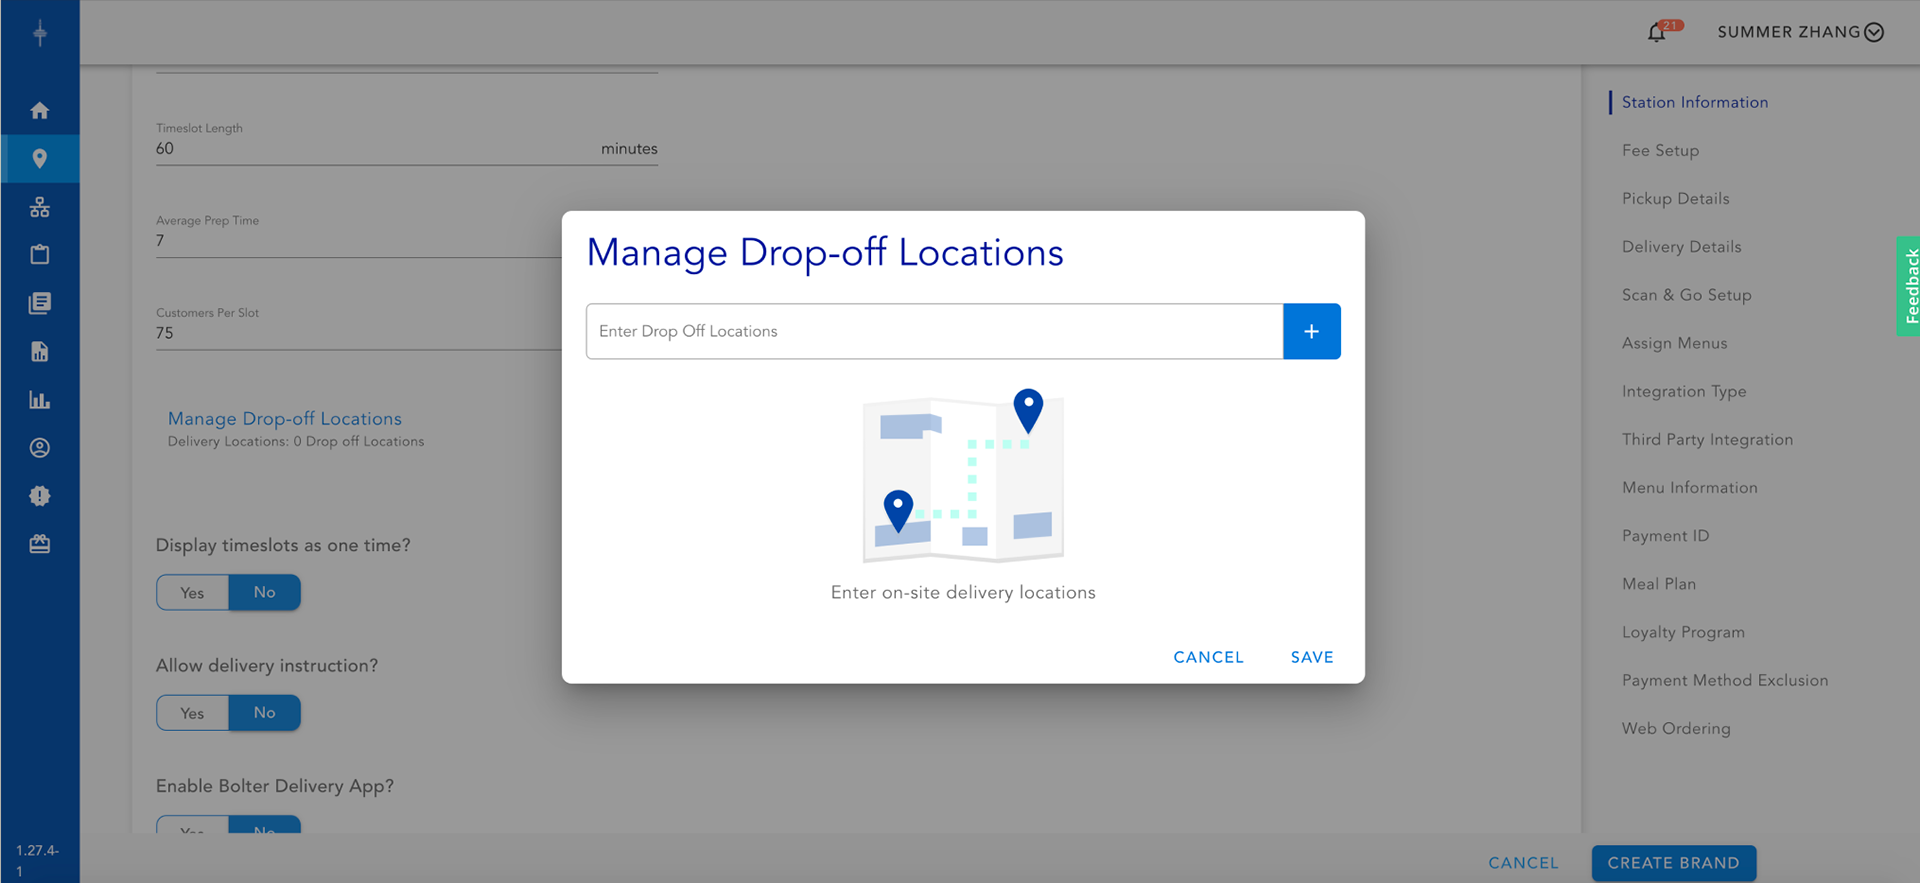
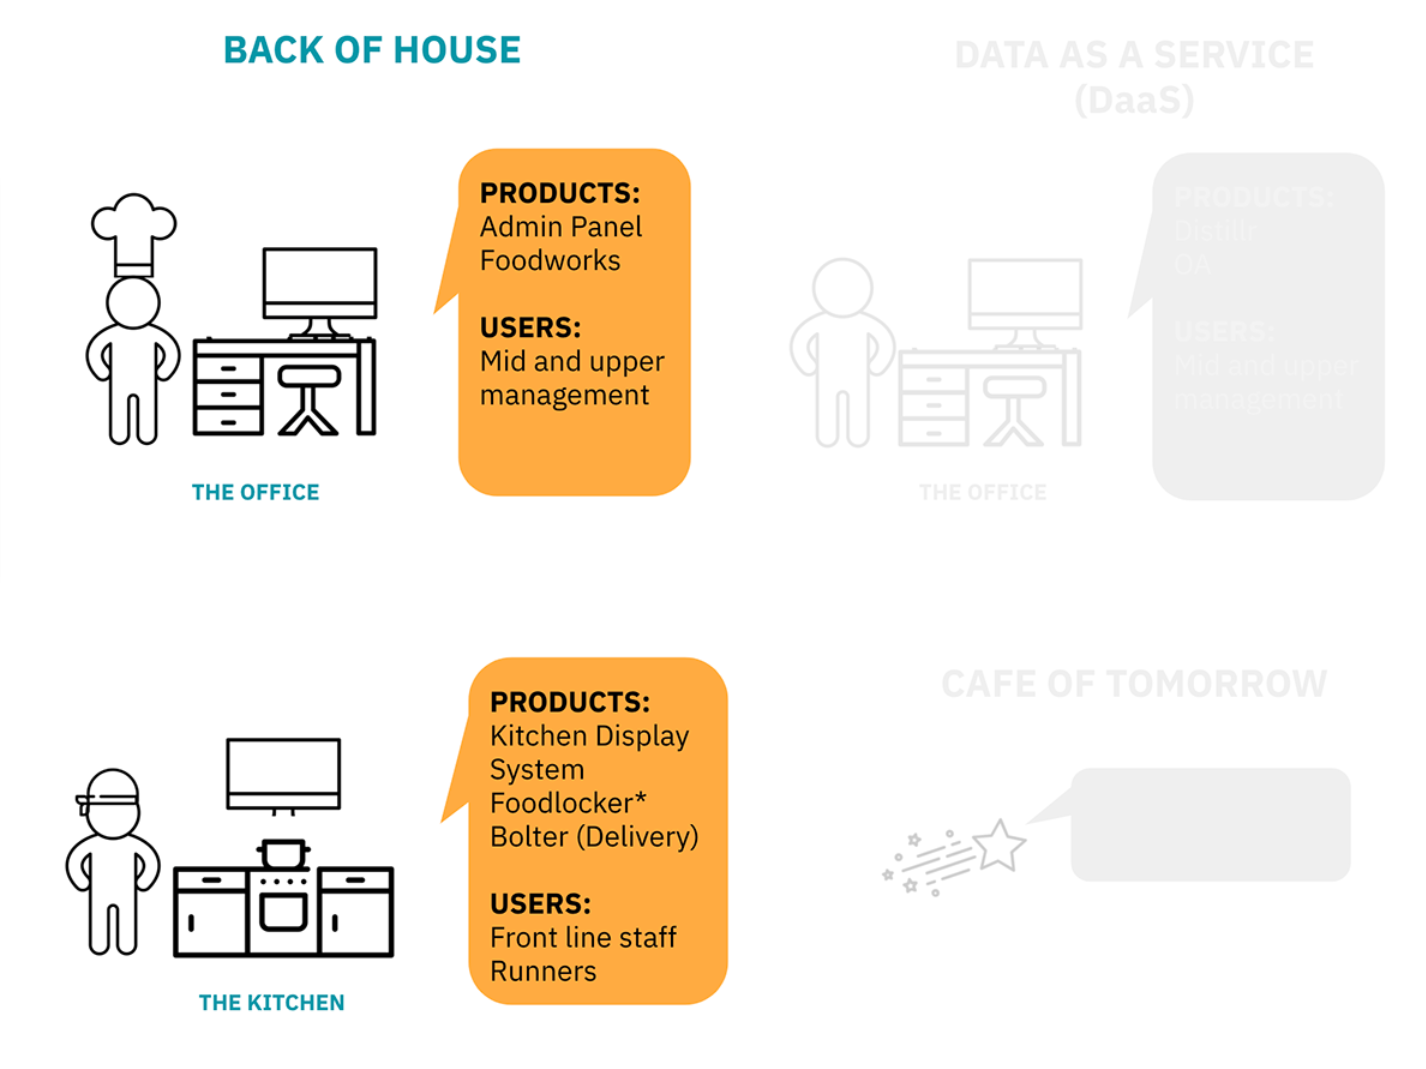
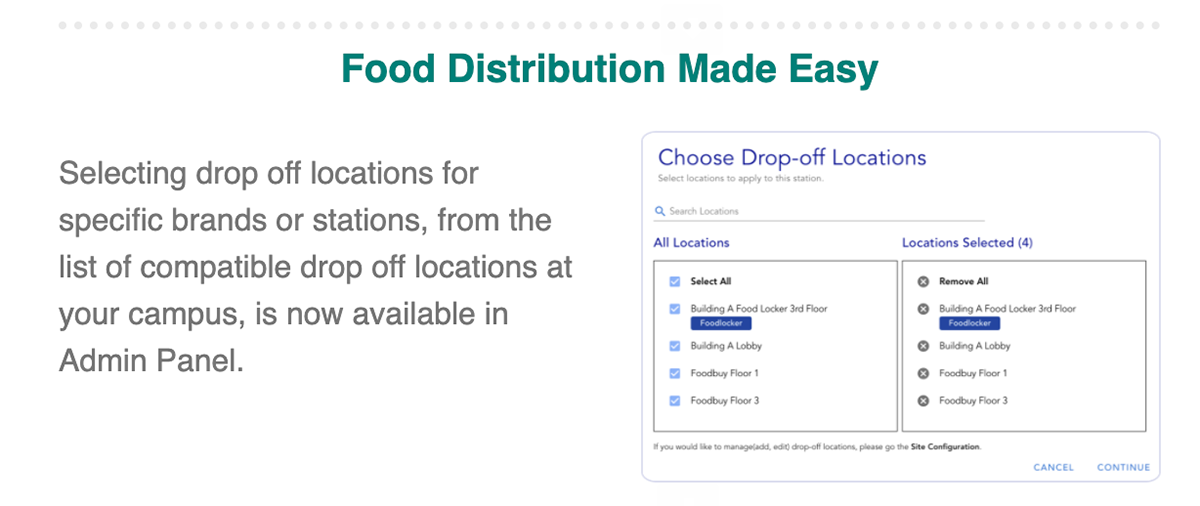
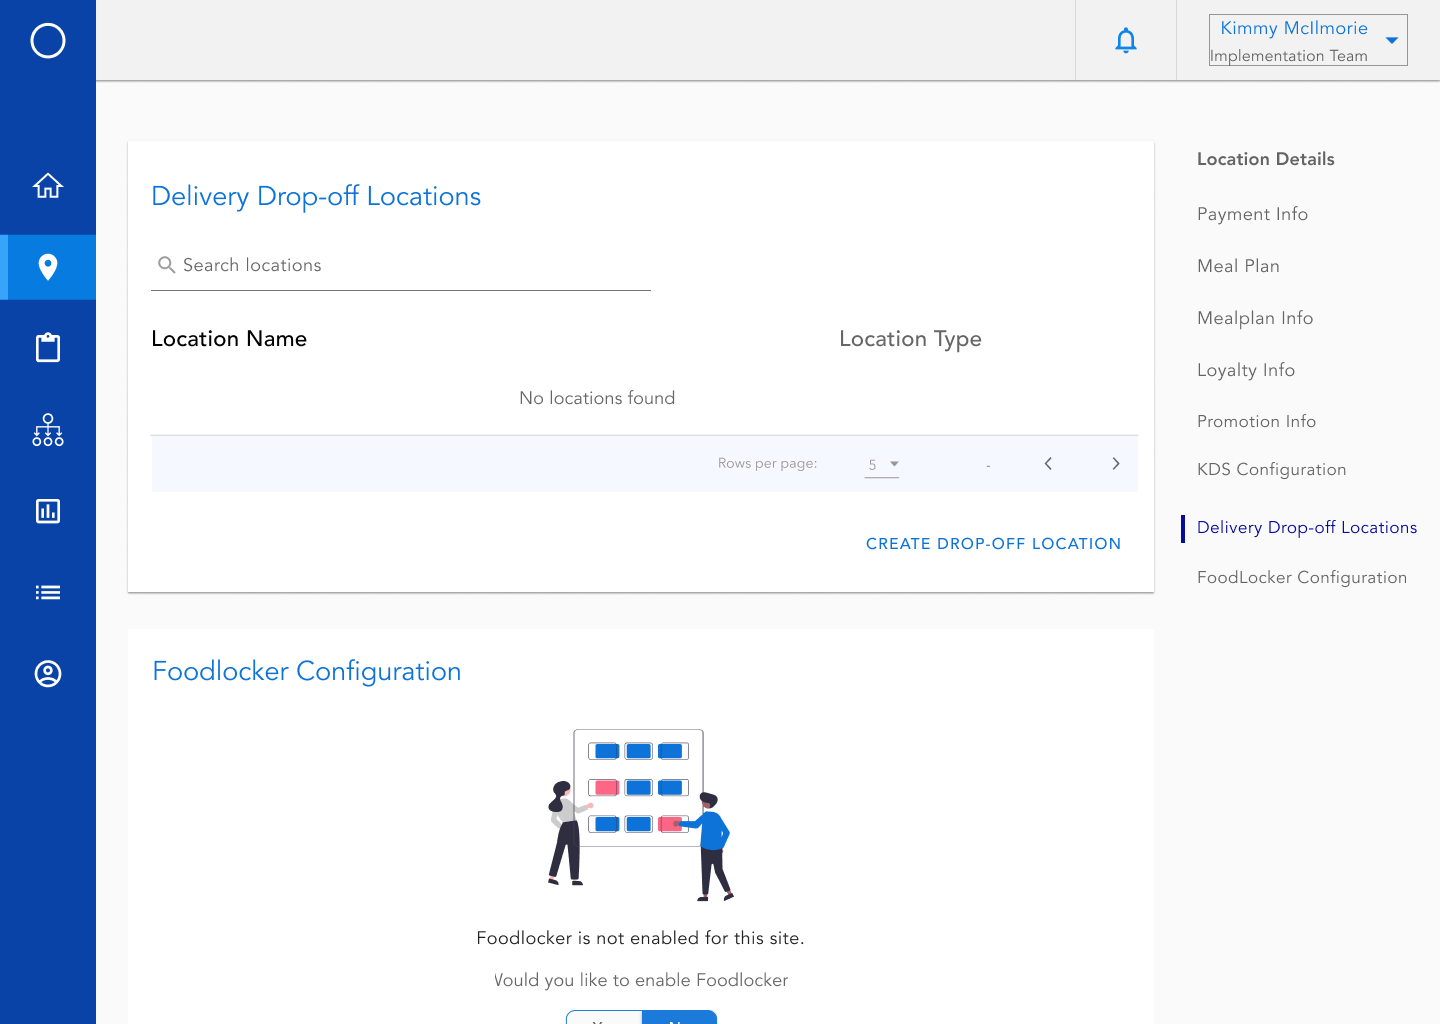
Current Delivery Drop-off Locations Configuration
Objectives
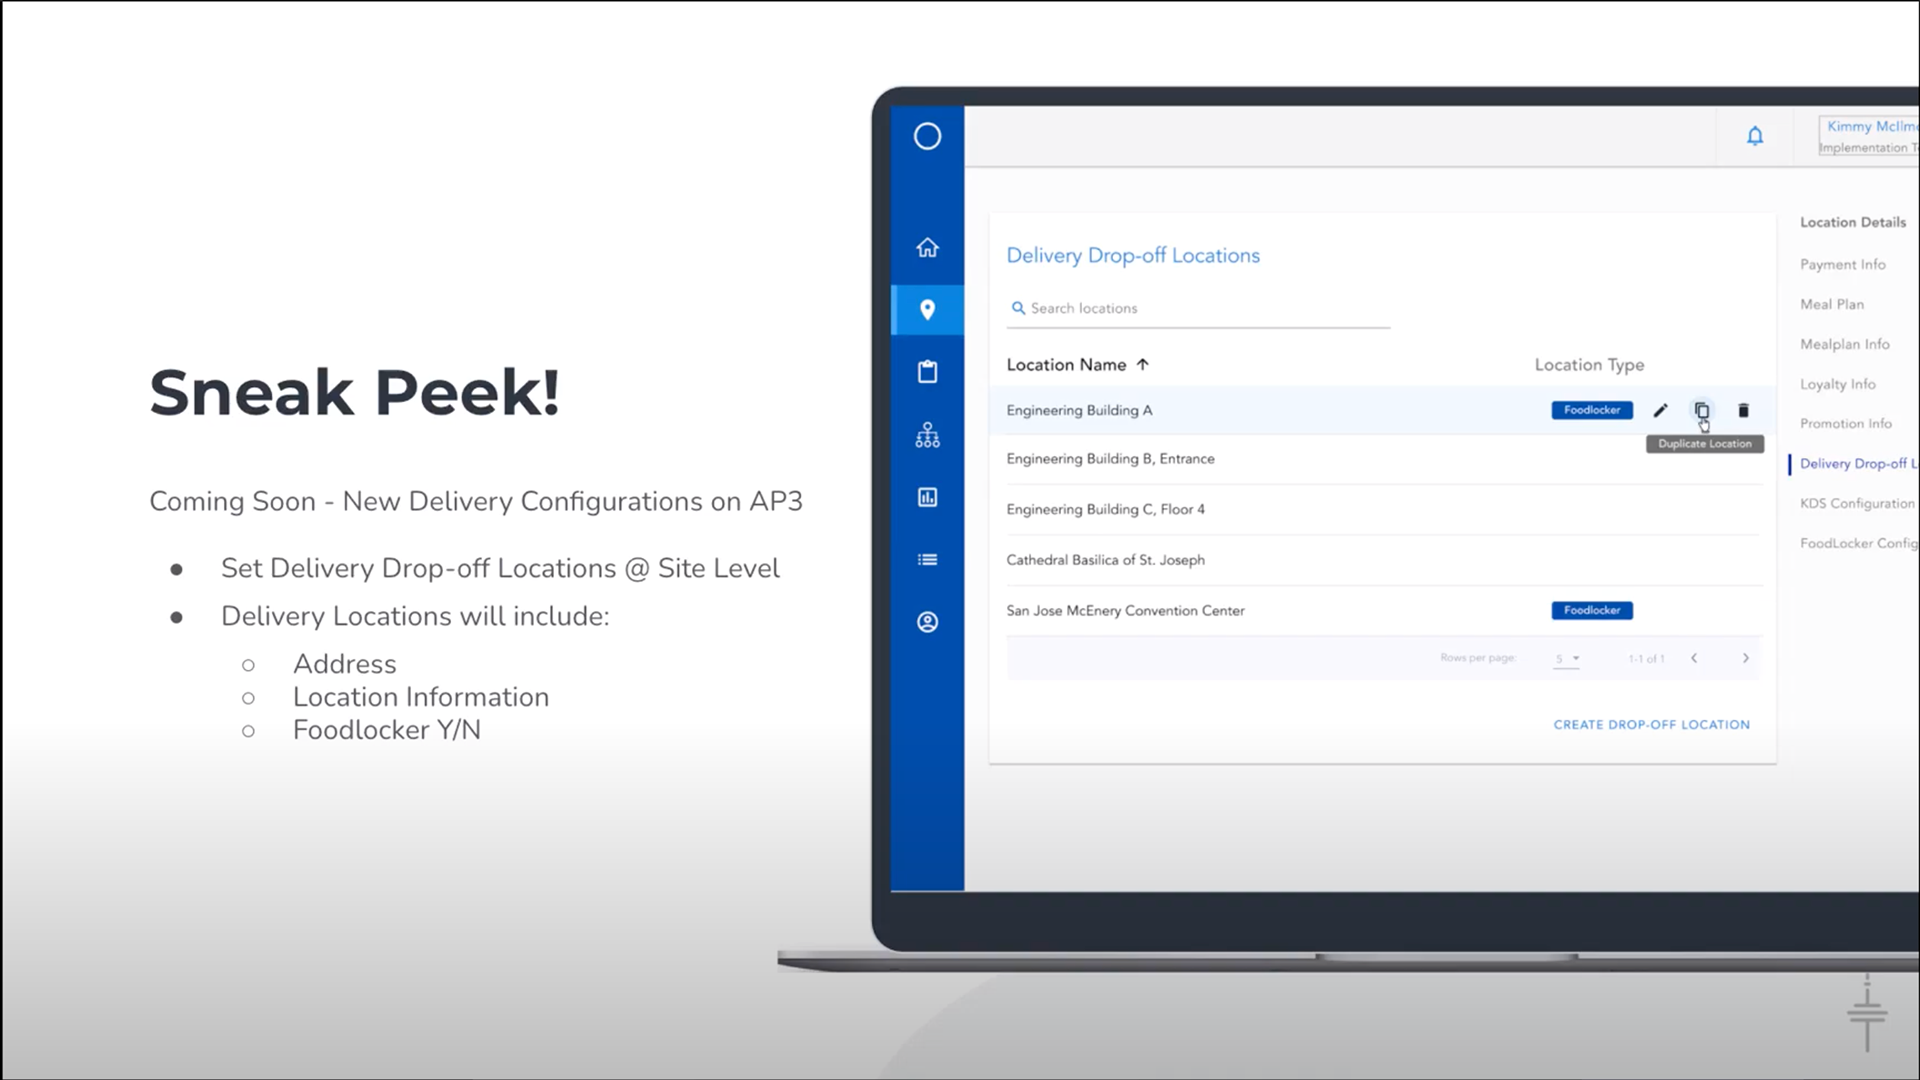
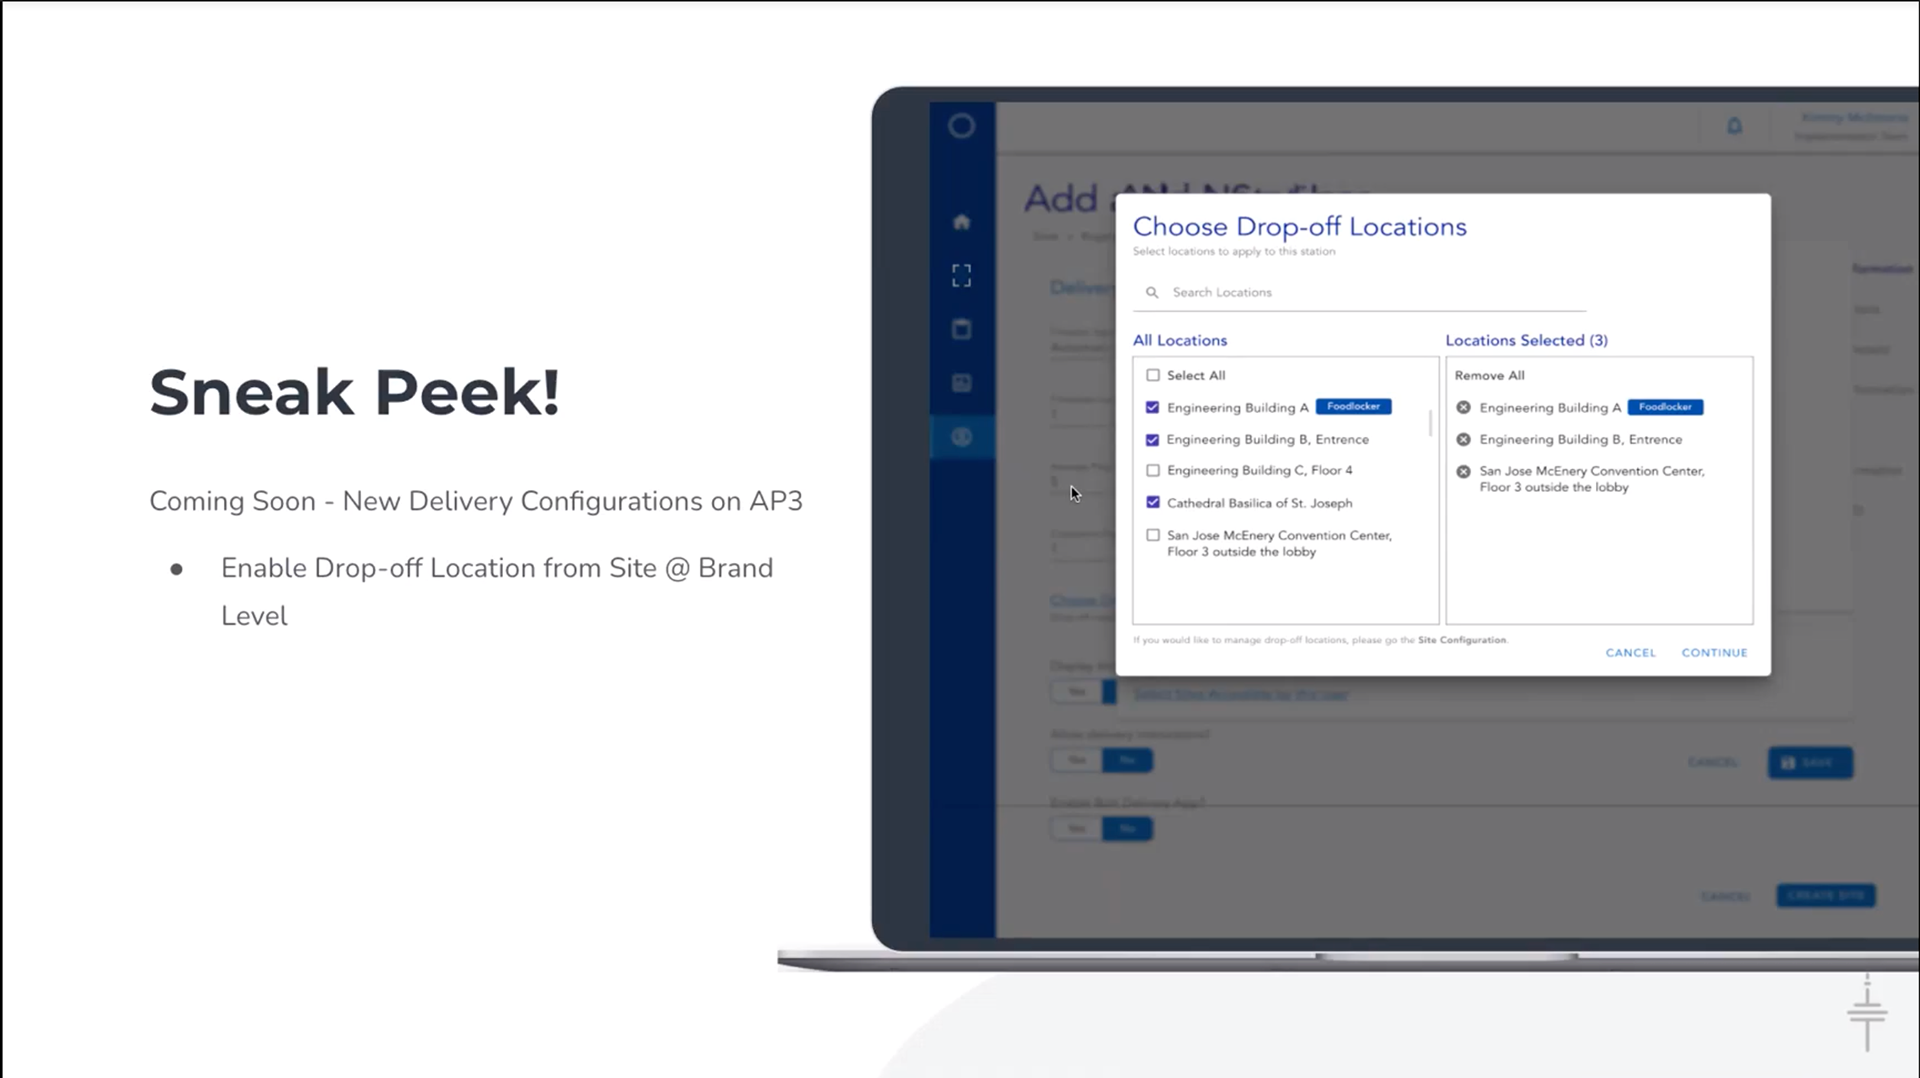
1. Simplify the delivery configurations process for Implantation Managers and Operators by reducing redundancy
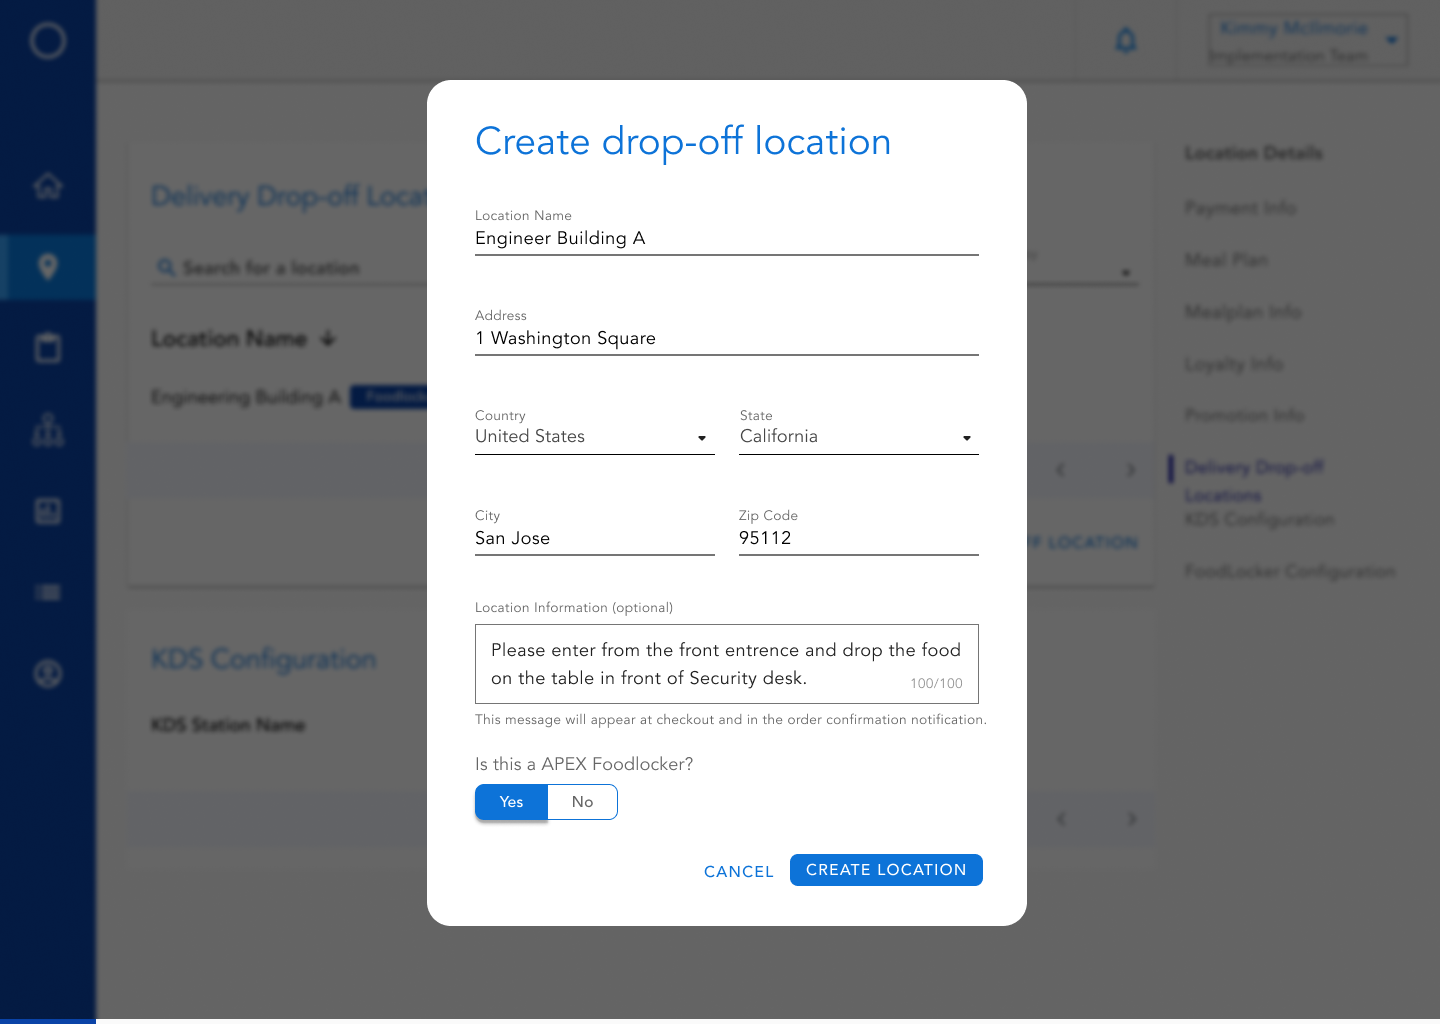
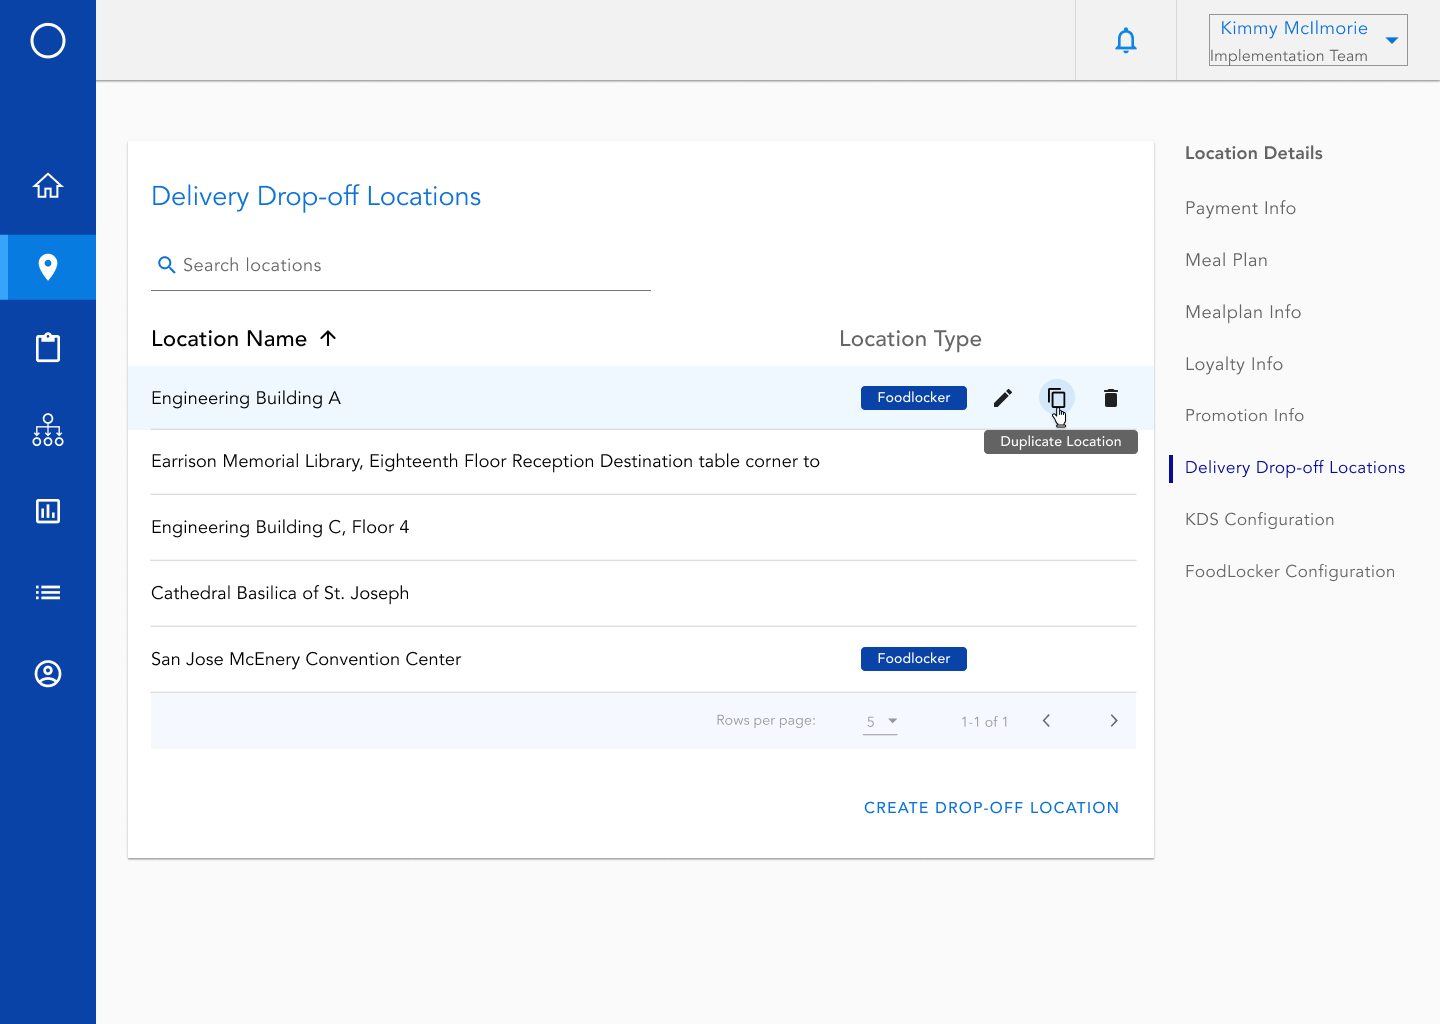
2. Expedite the process with autofill and duplicate functionality
3. Change hierarchy of information so there is less repetition of information
4. Add required address information for 3rd party integrations and future improved customer experience
Ex. Autonomous delivery robot requires address information
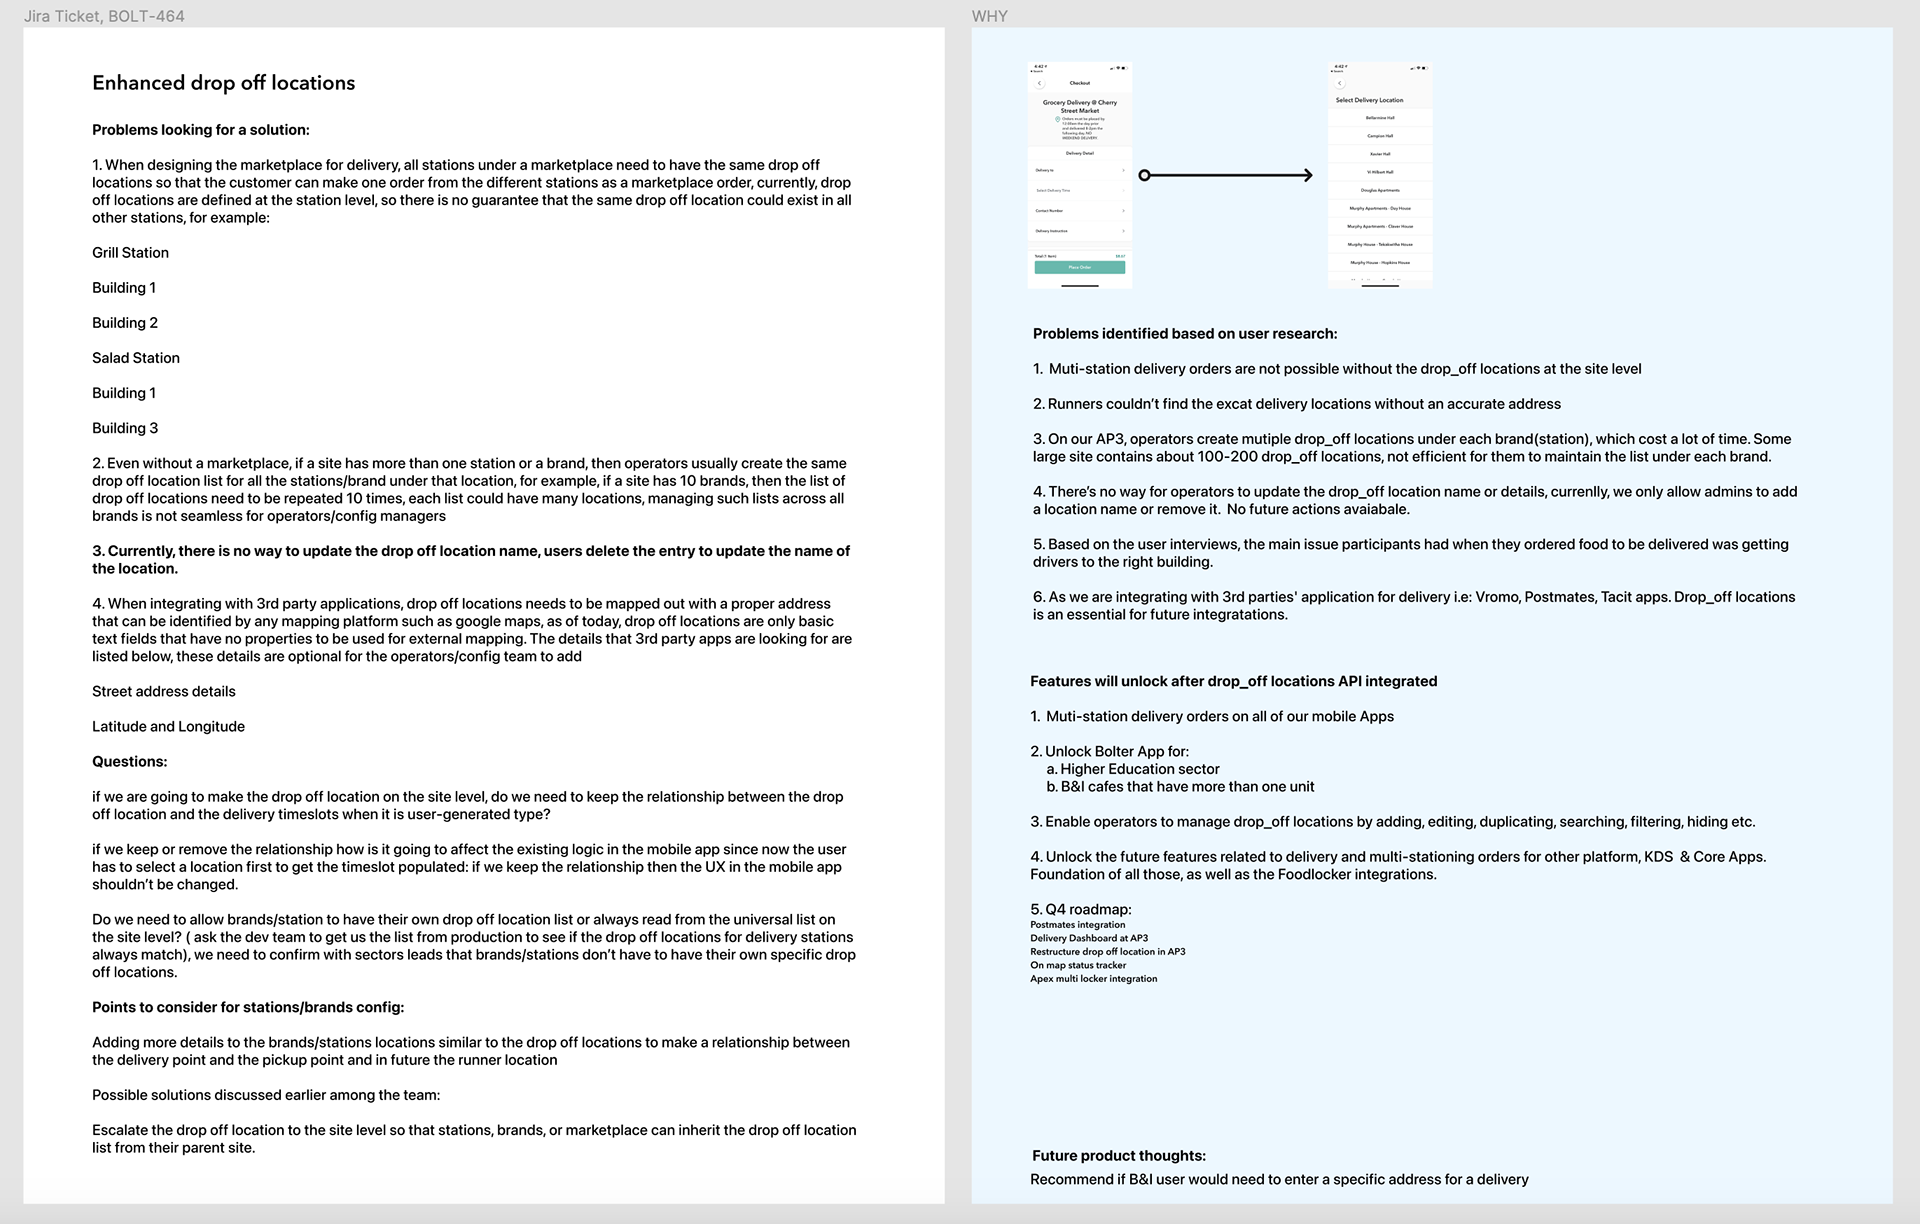
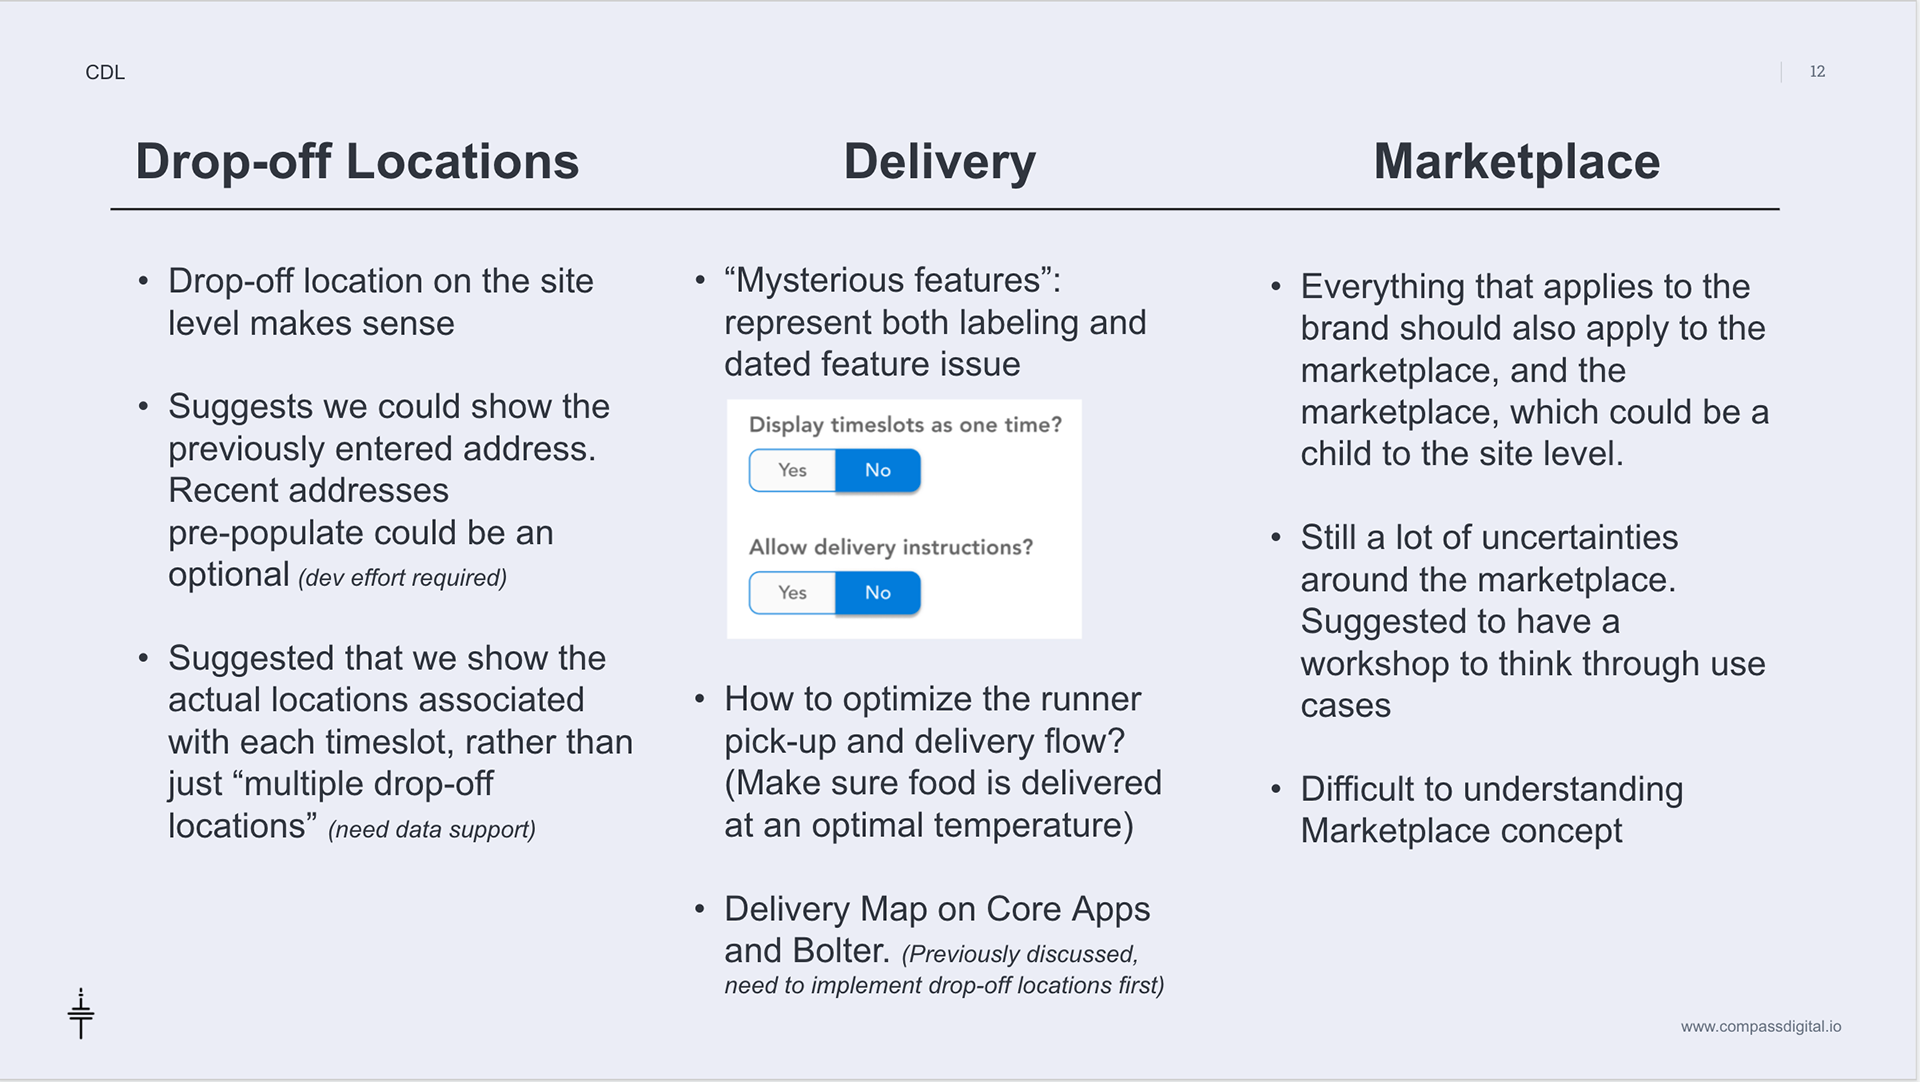
Research
I started with research by understanding the problem space, synthesize information from available sources. I created the current visual flow, gathered data and read through all previous studies related to this problem. The research parts created the foundation for my project. I also did a competitive analysis.
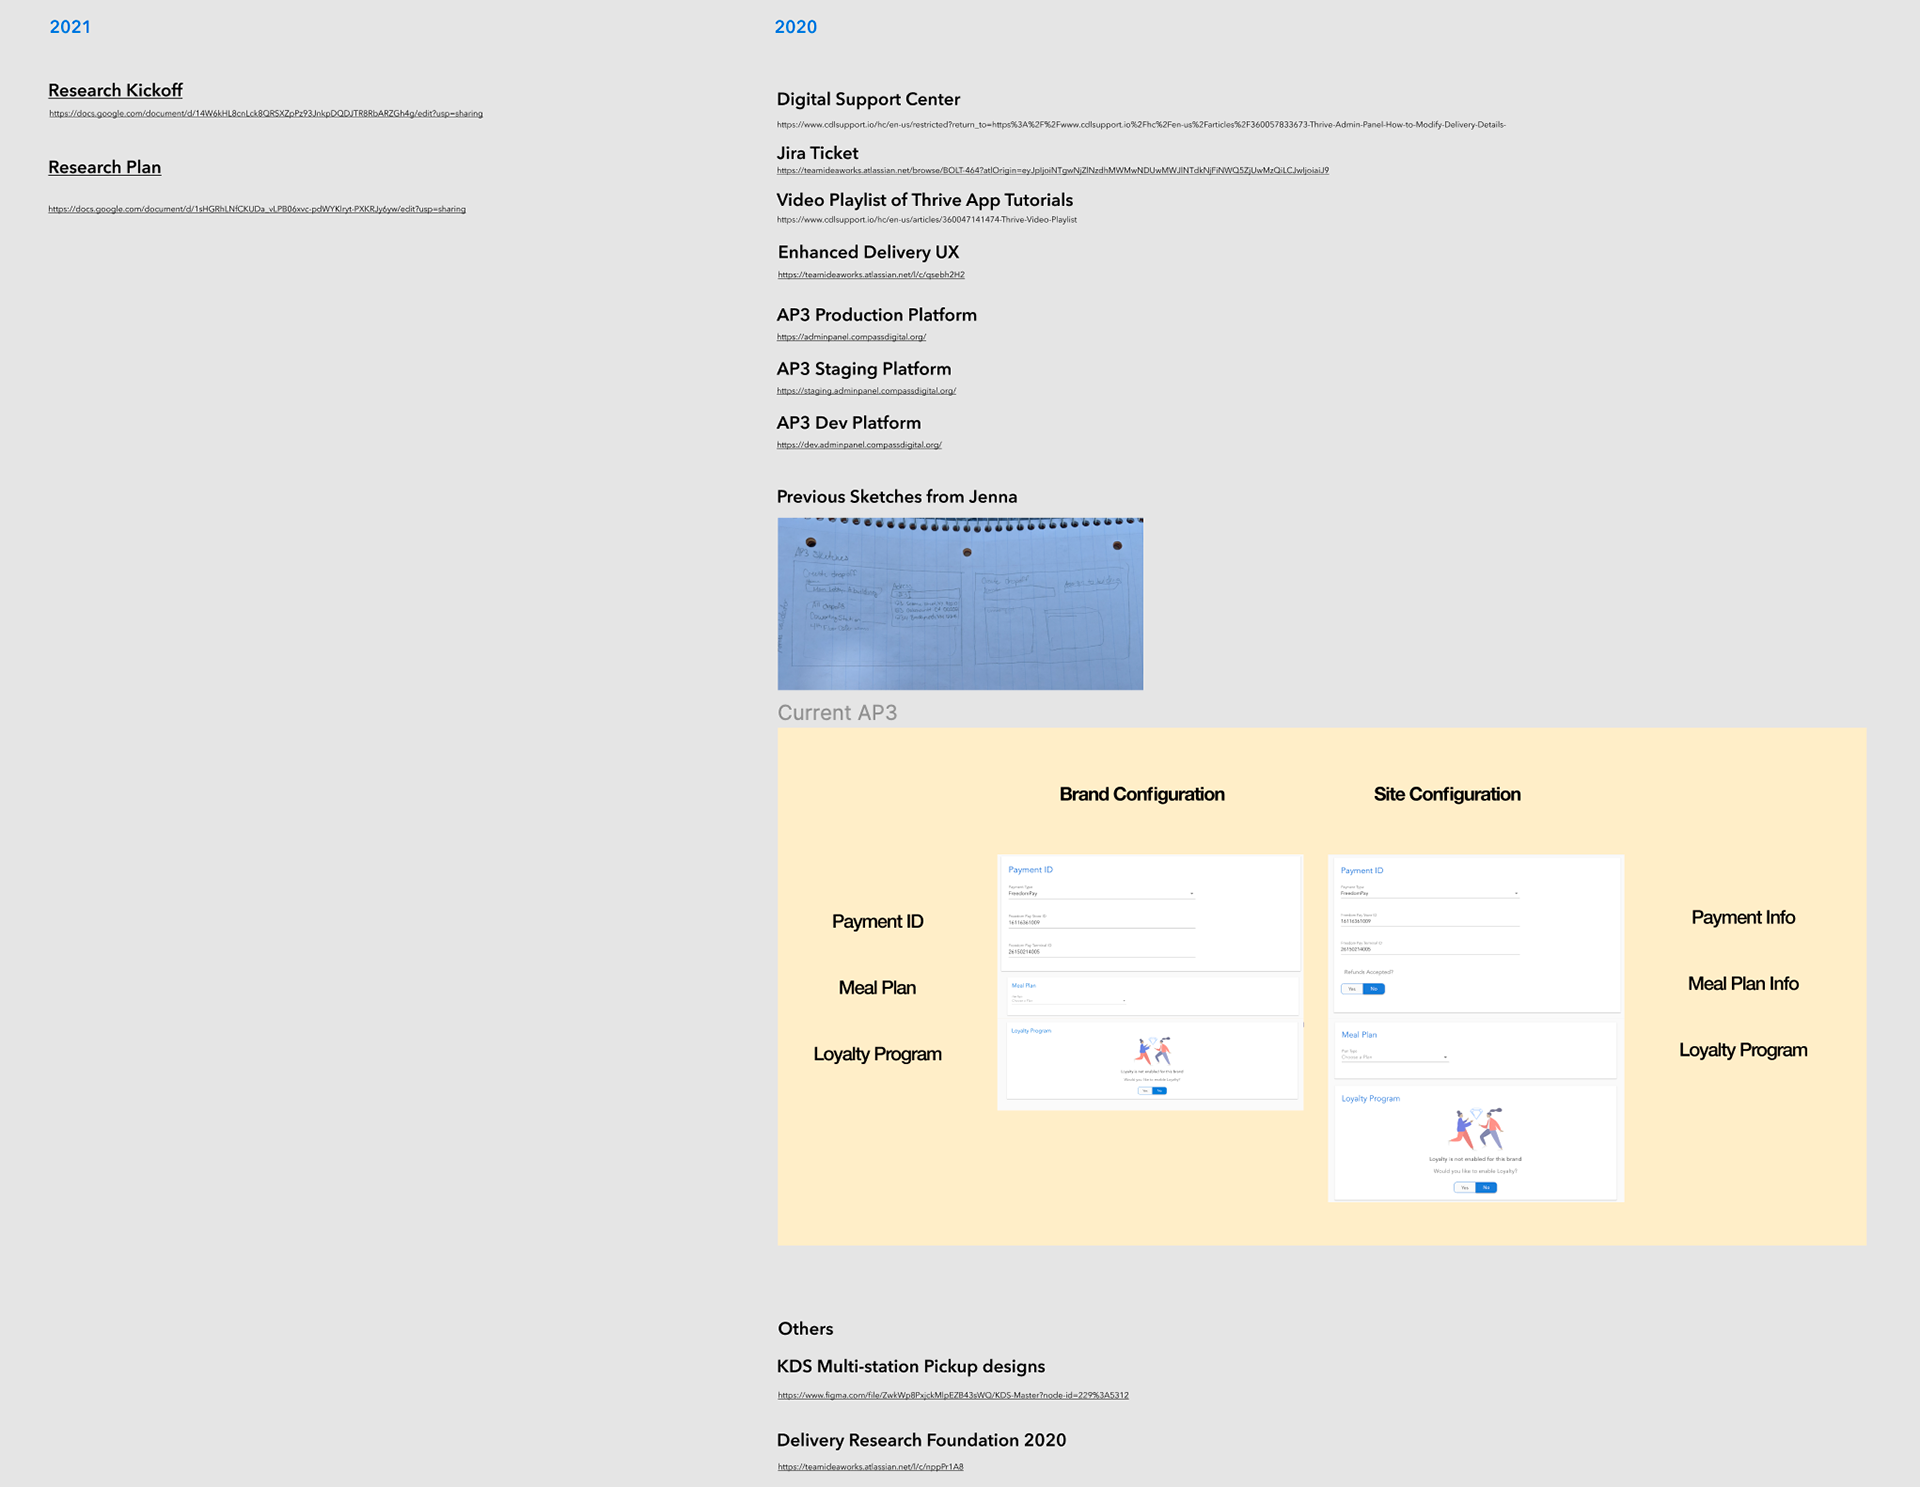
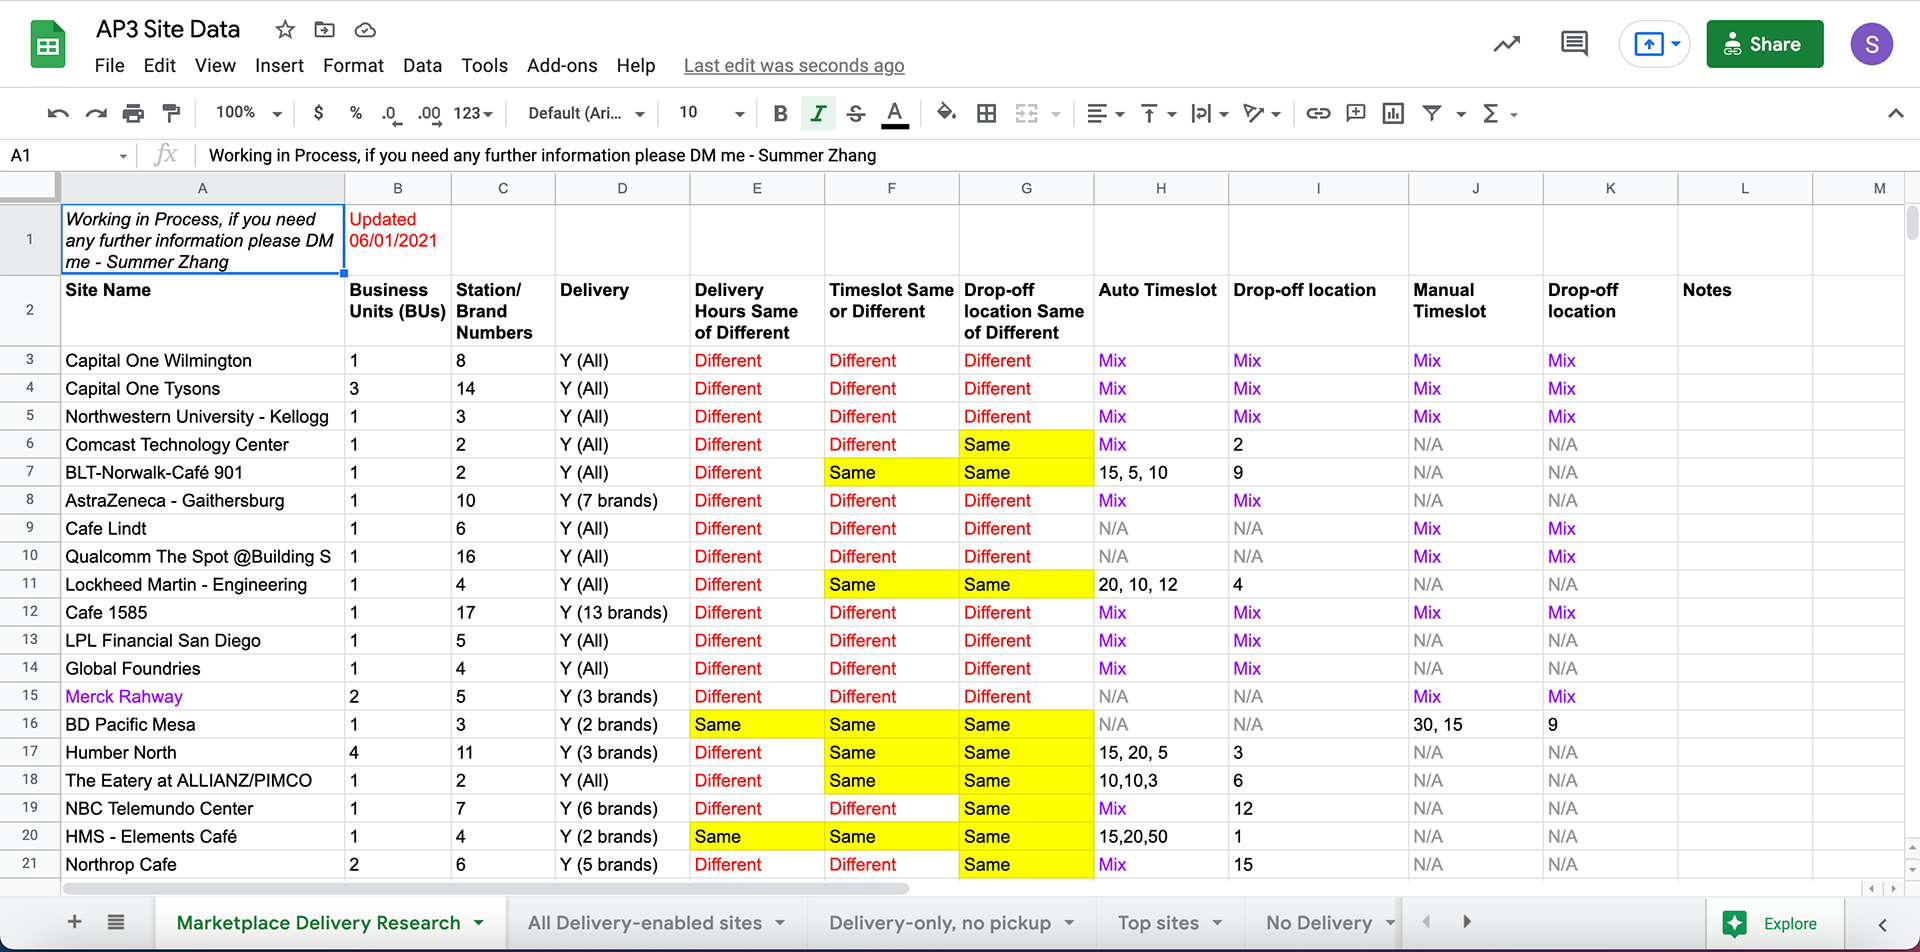
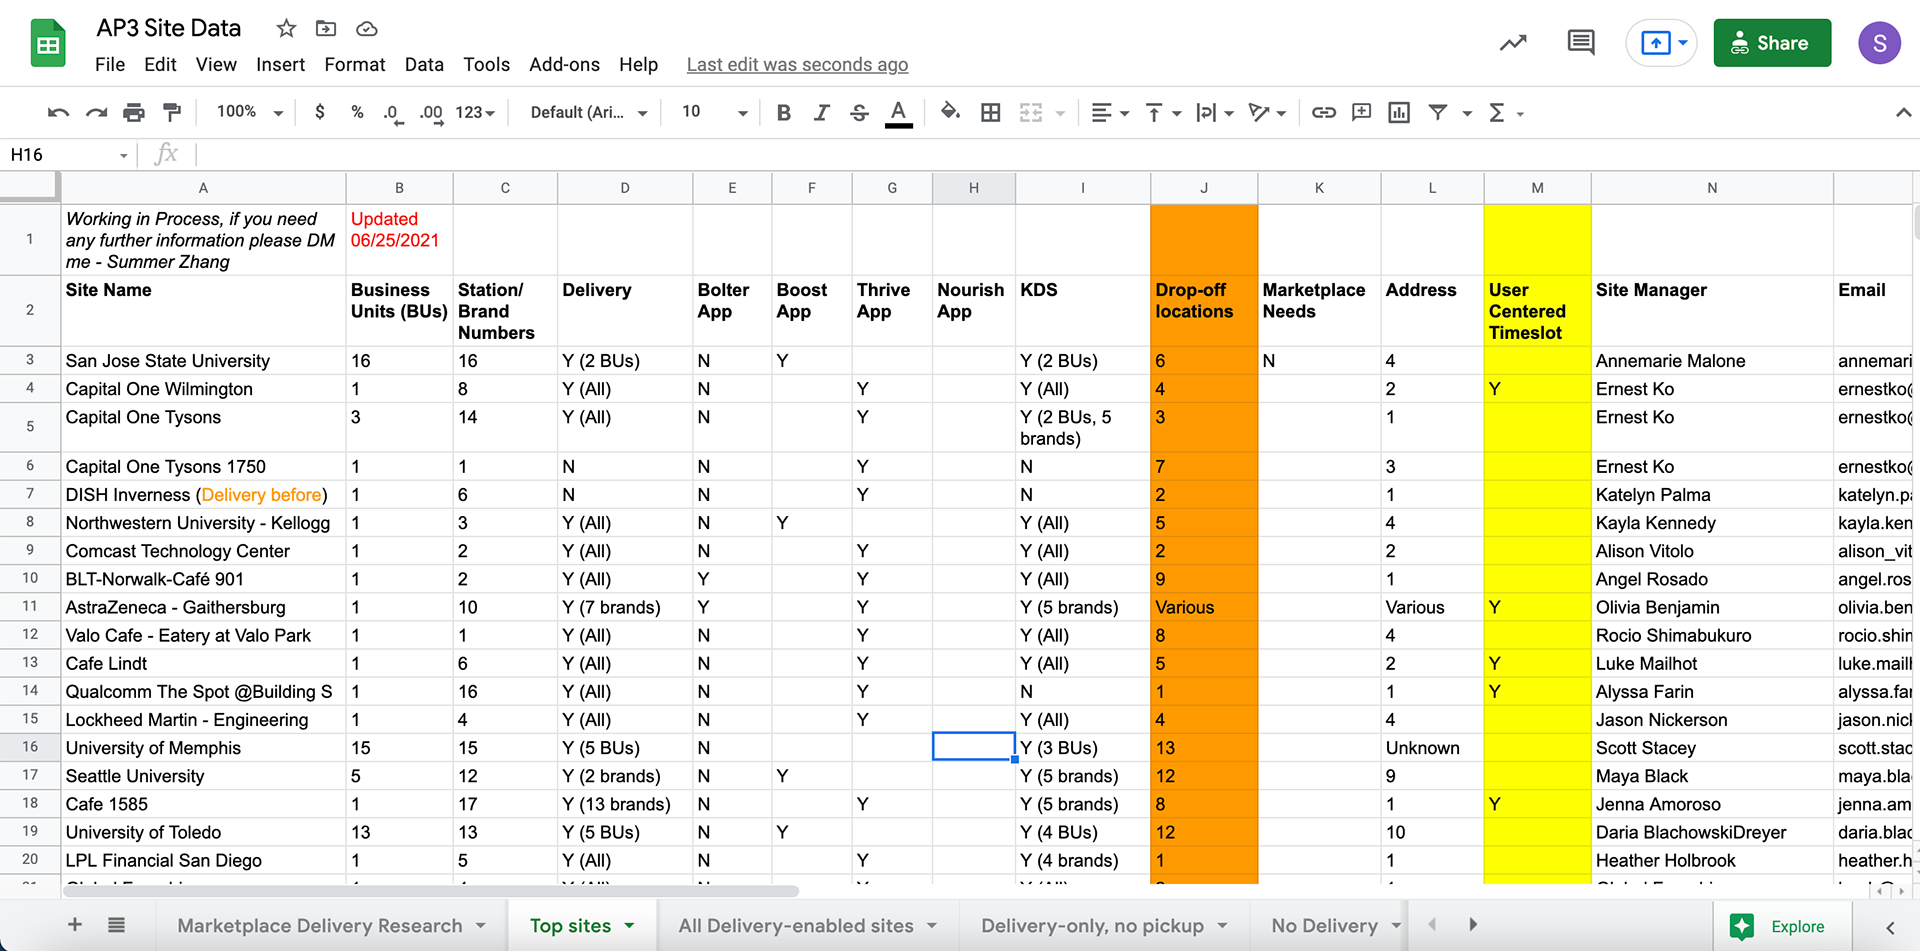
Research collection links
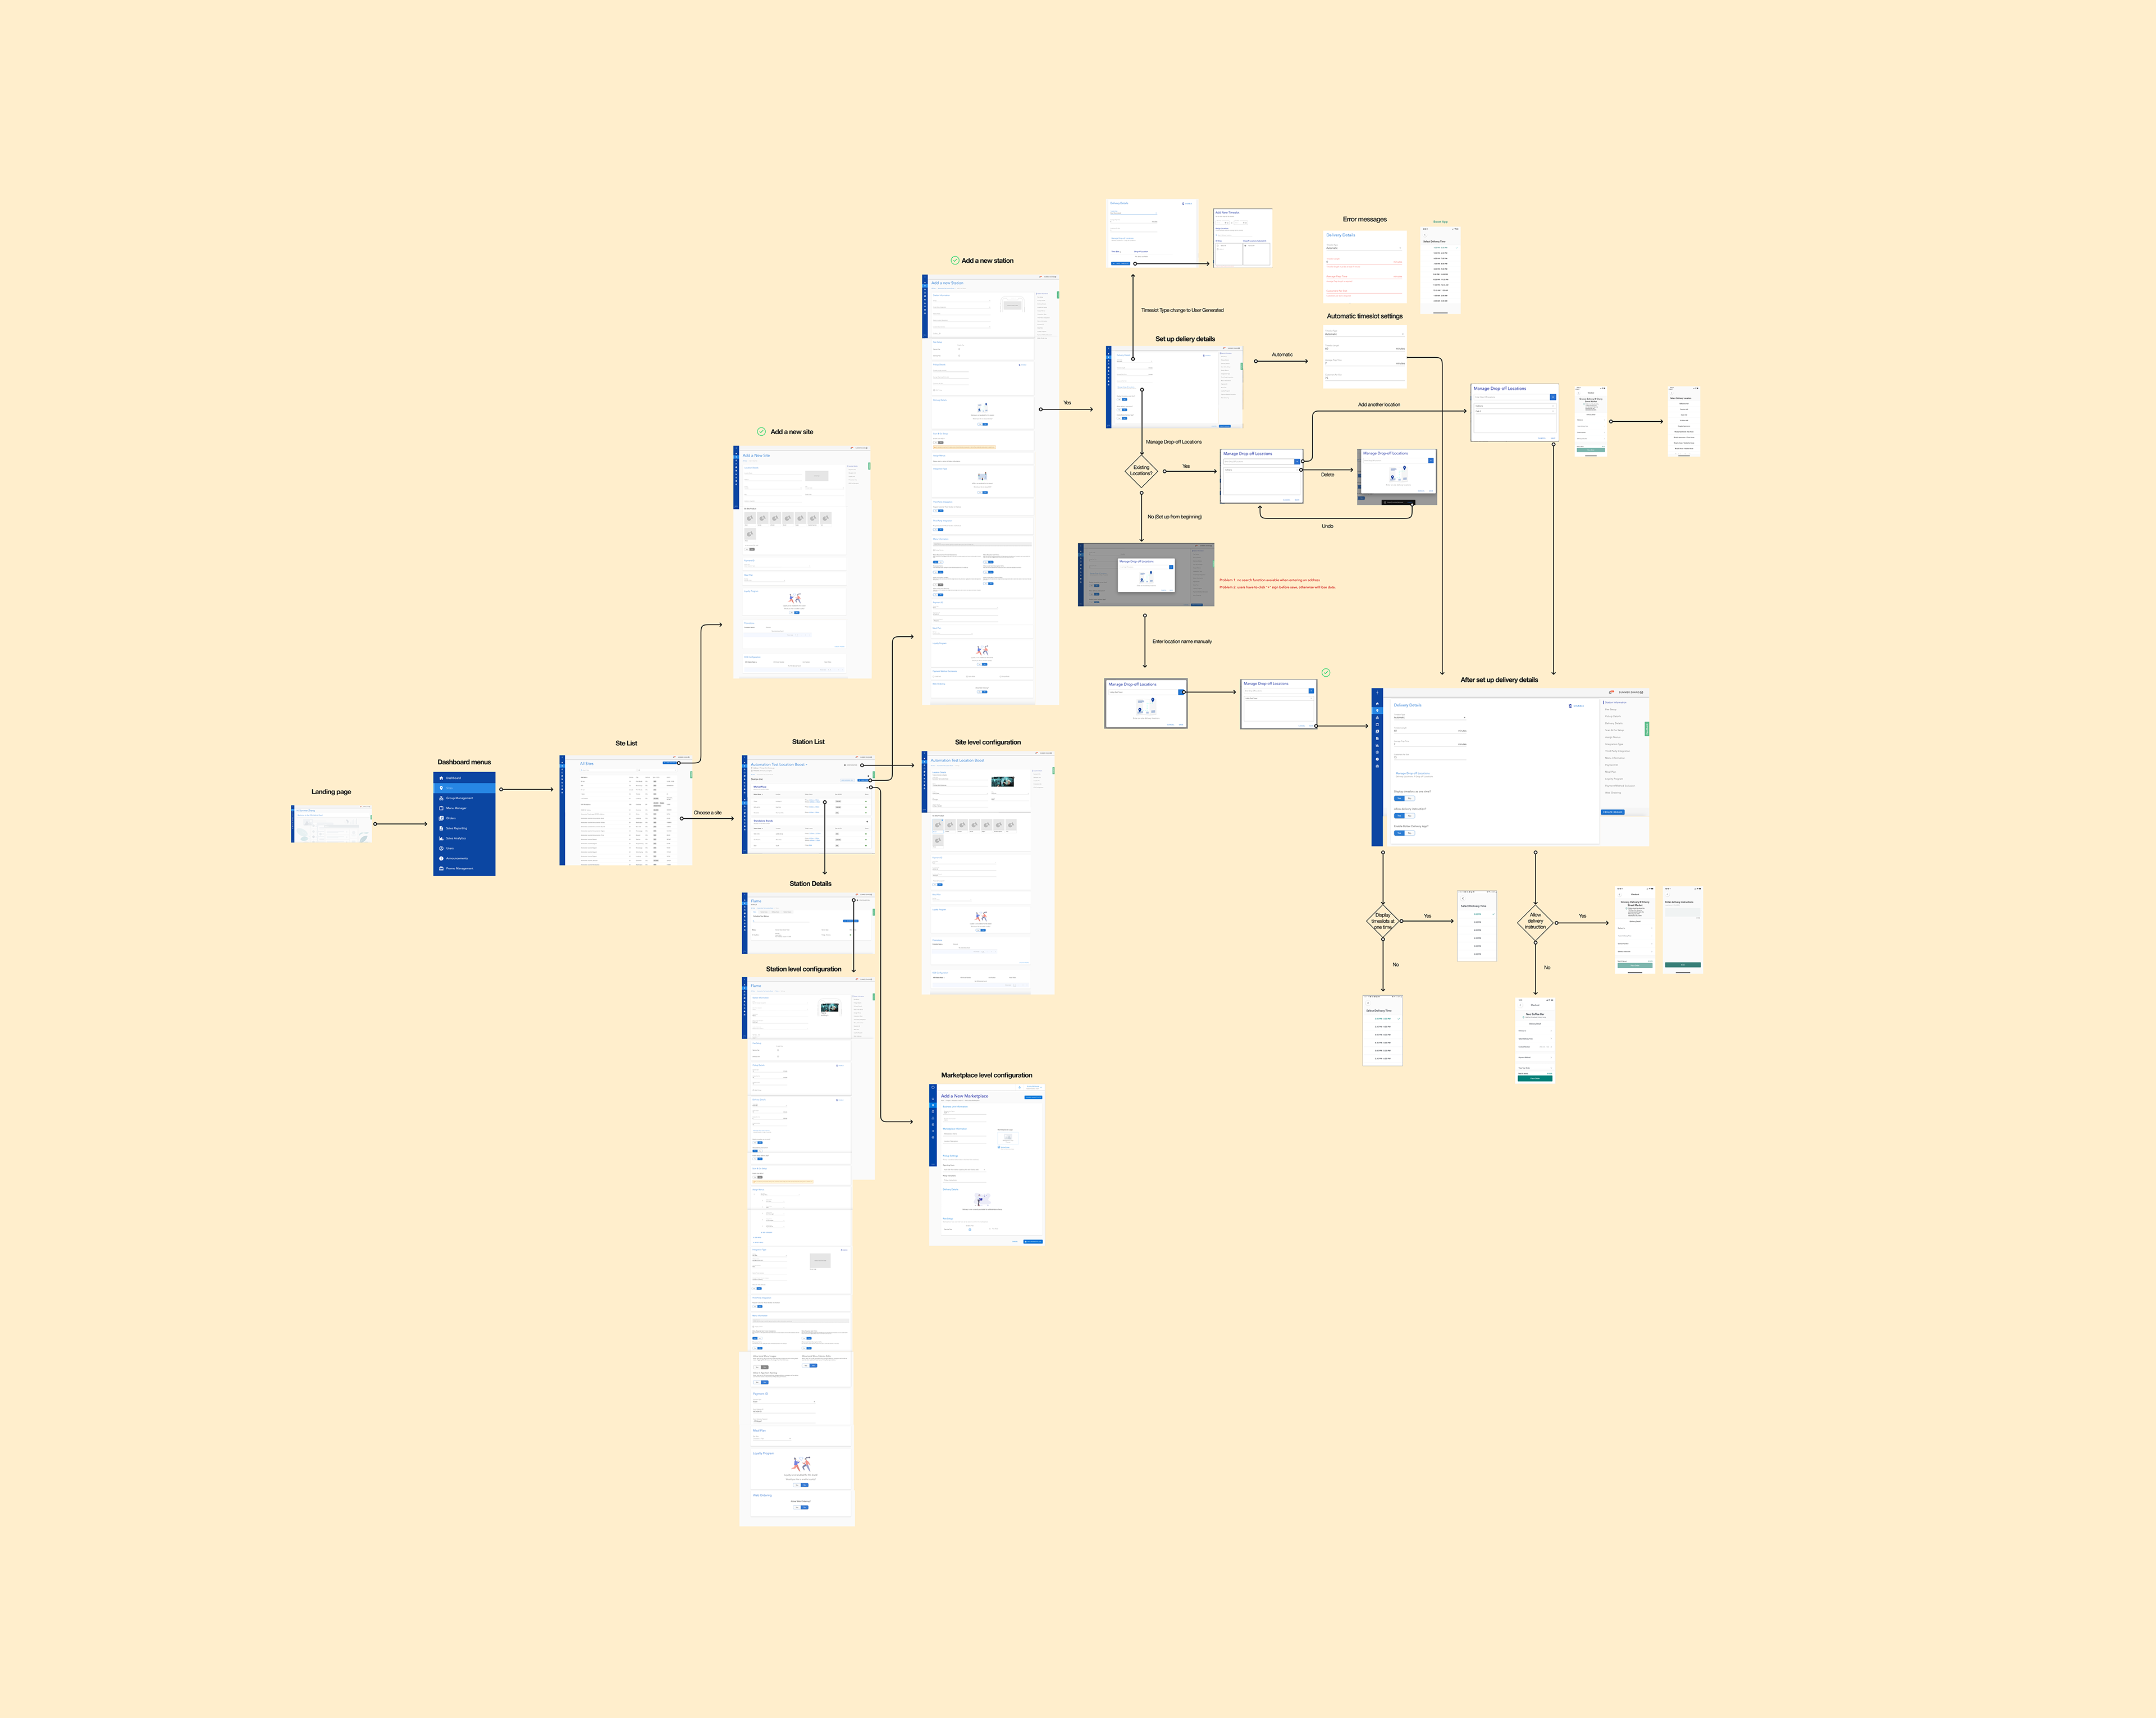
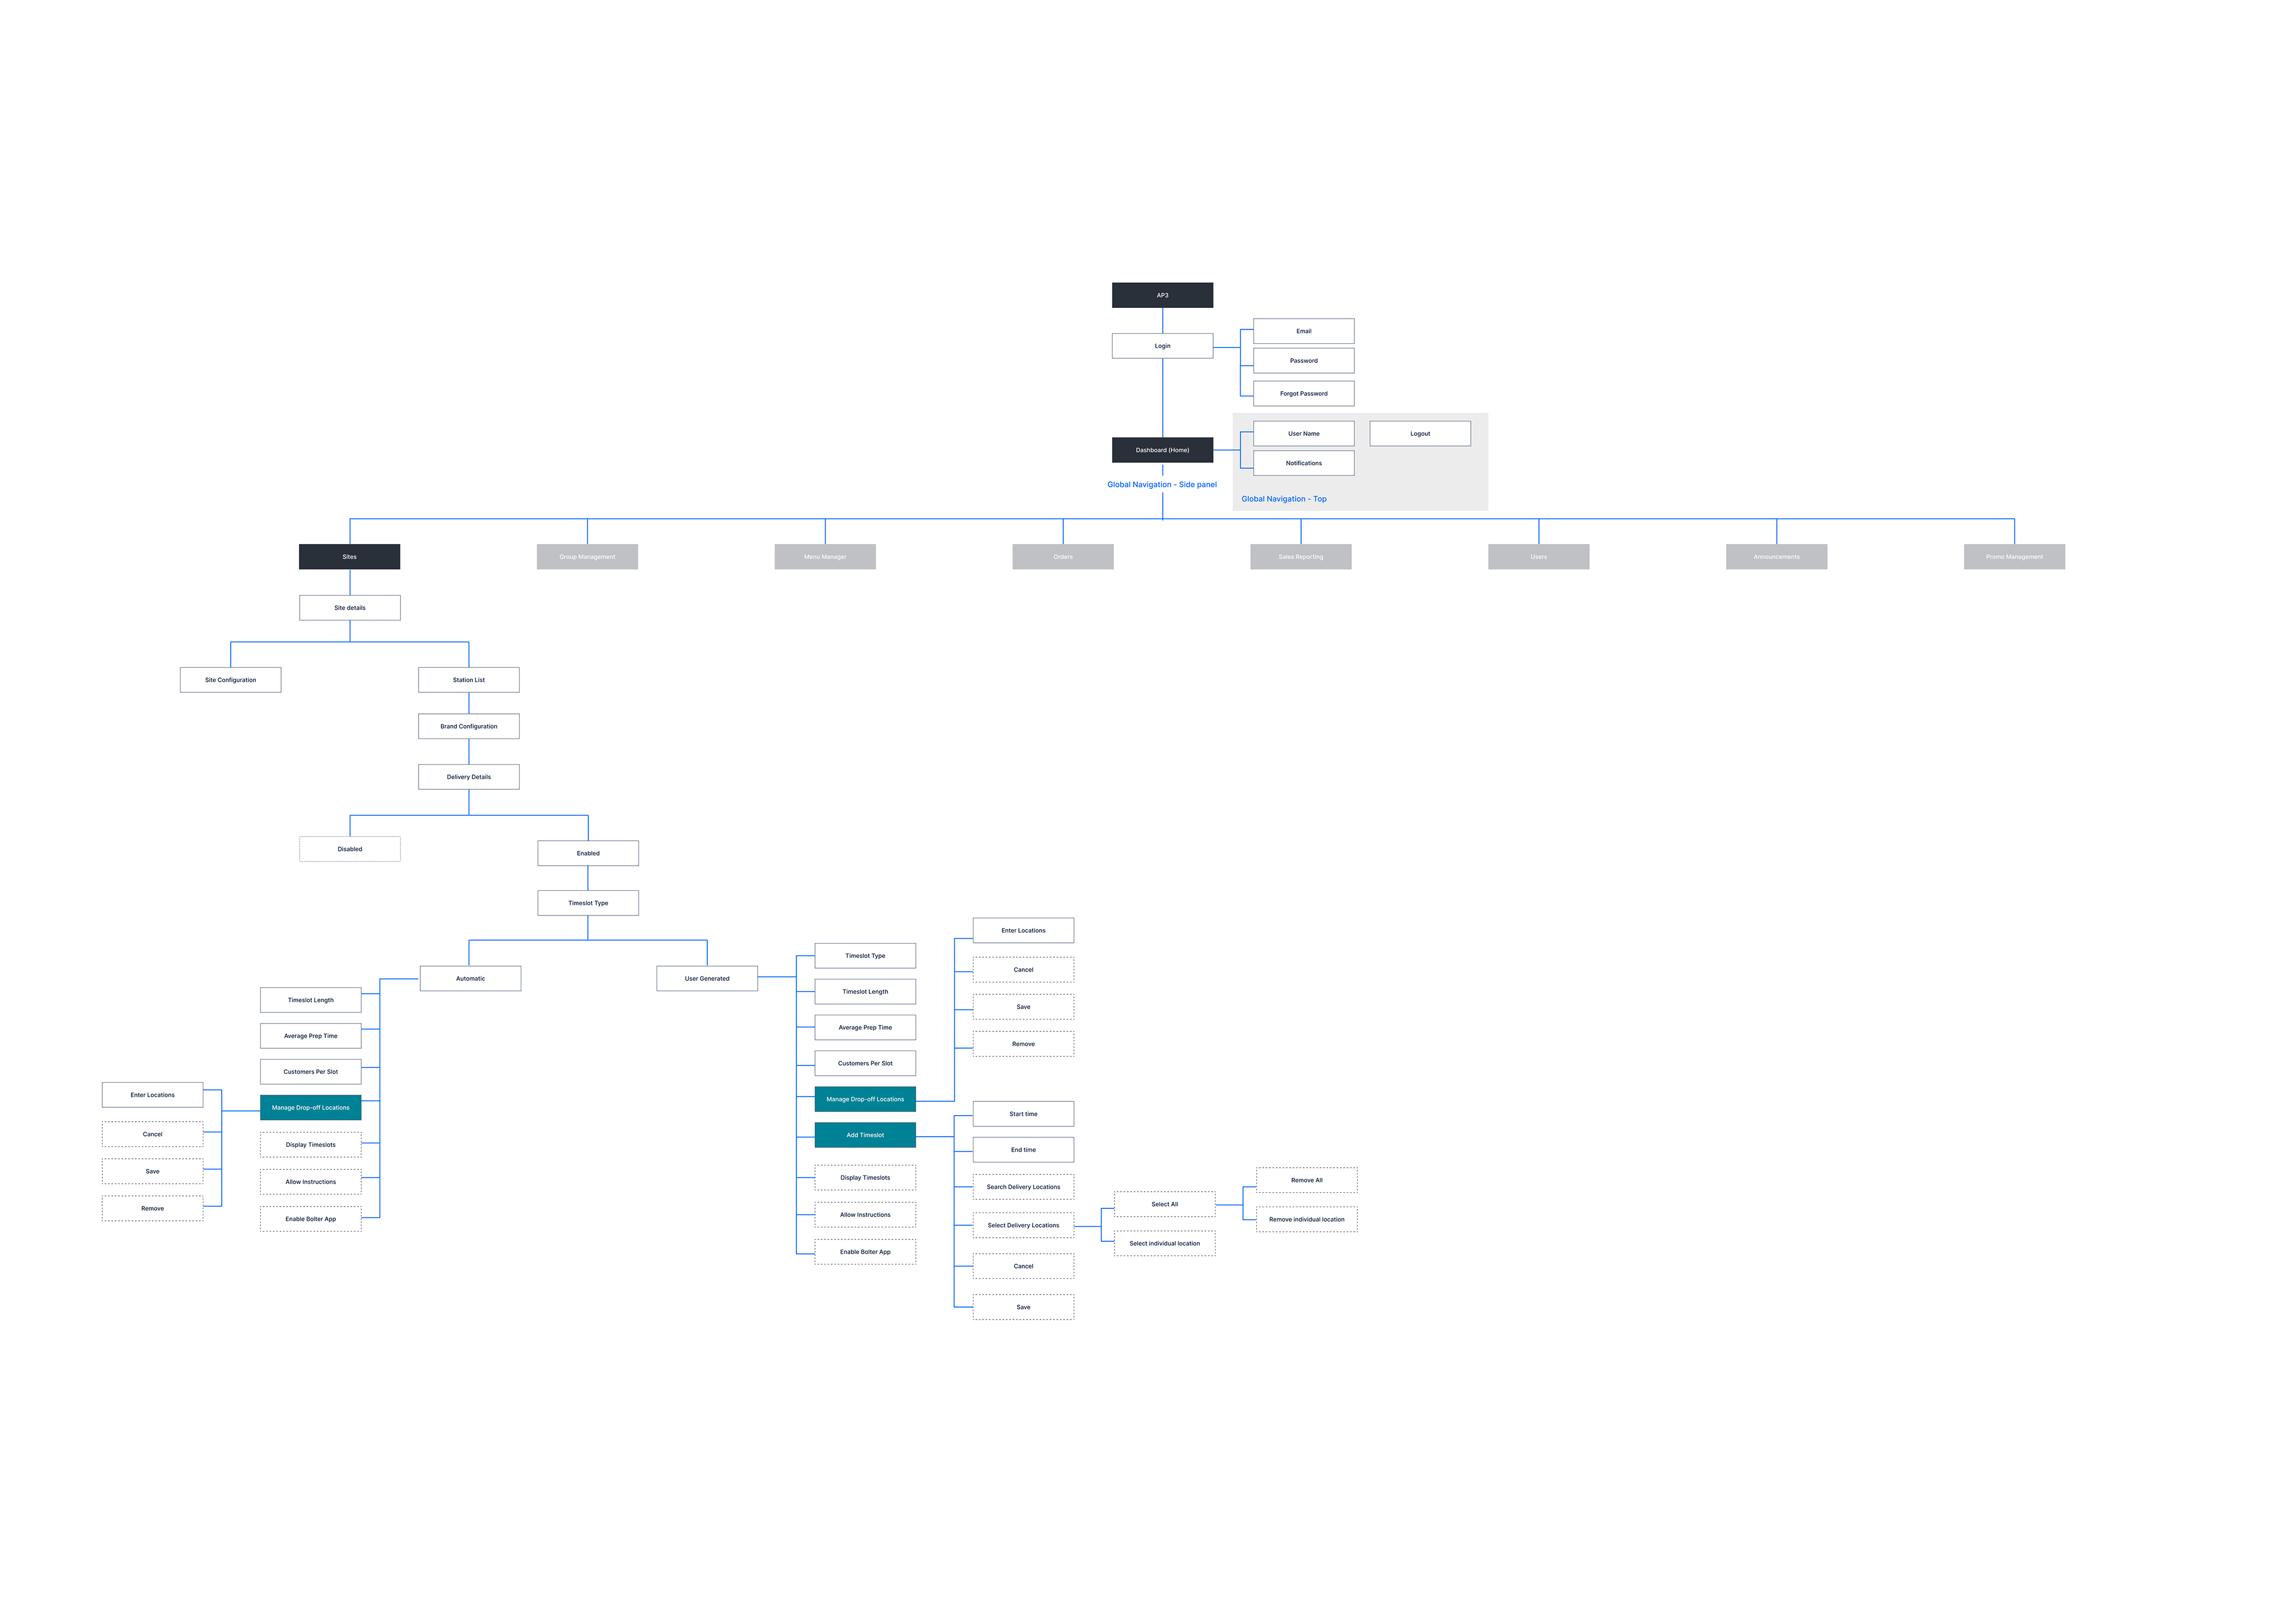
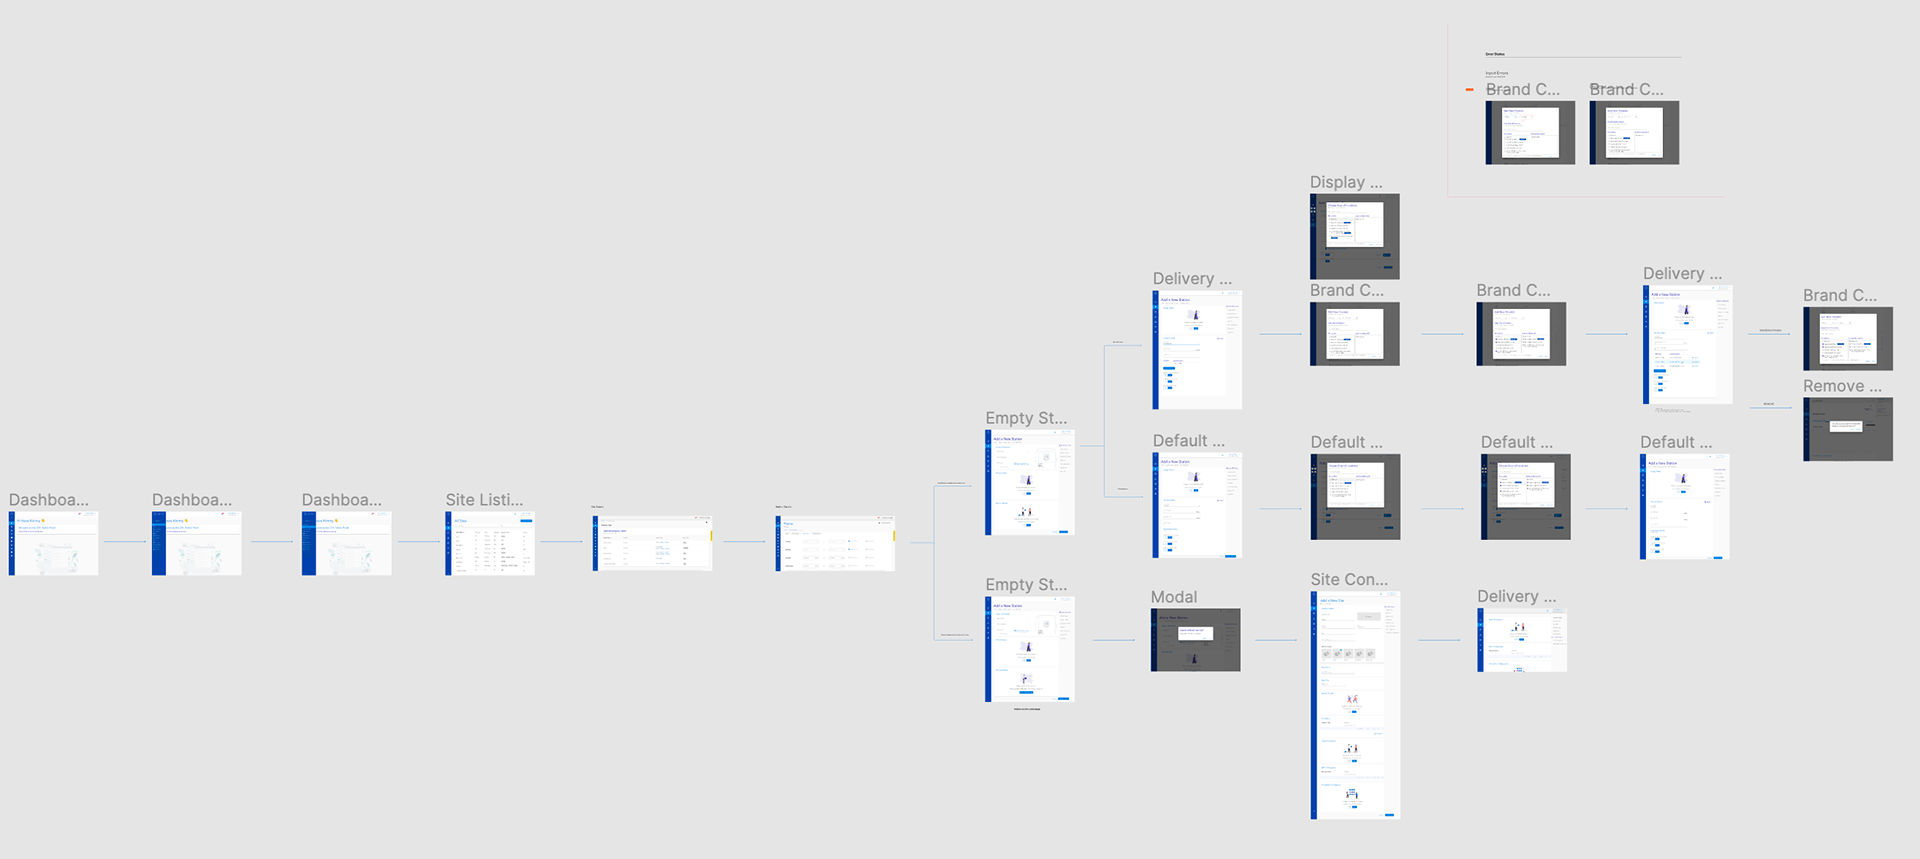
Visual site map of current process
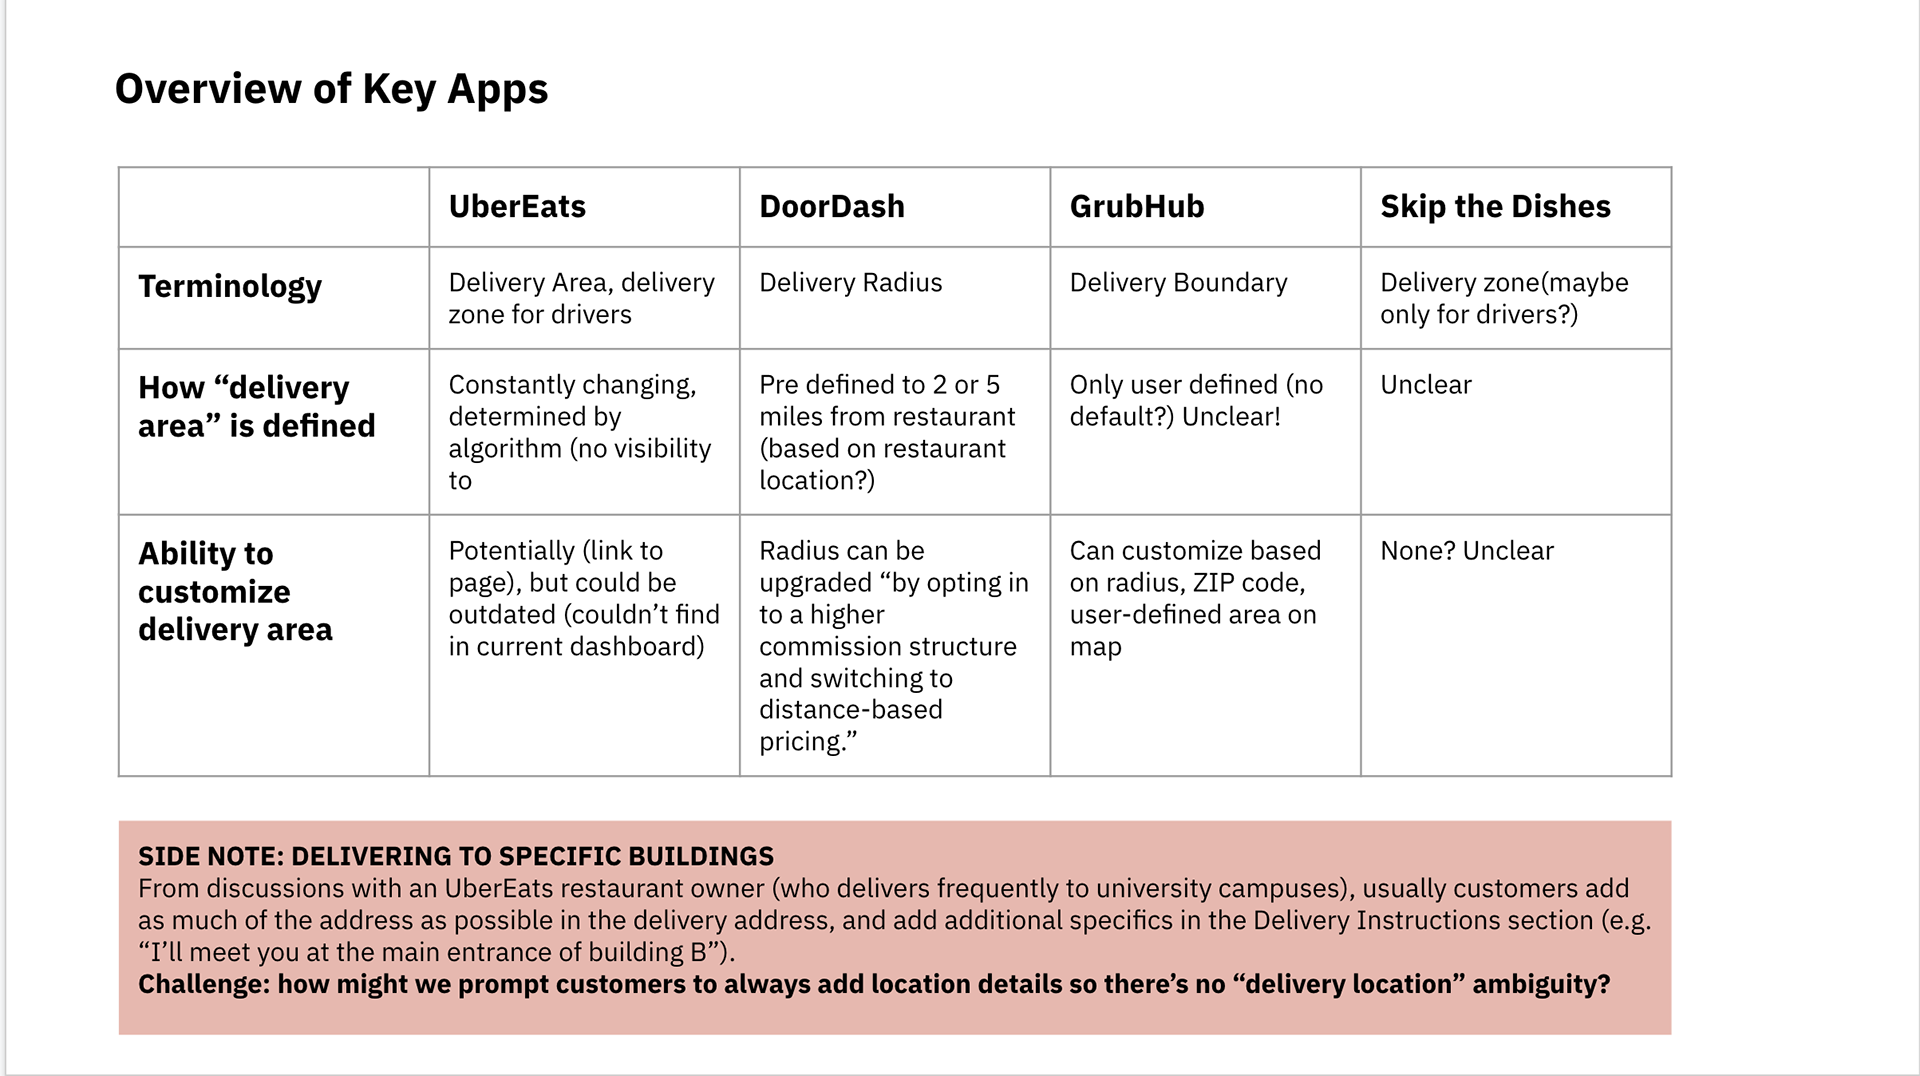
Overview of competitive analysis
Site Map
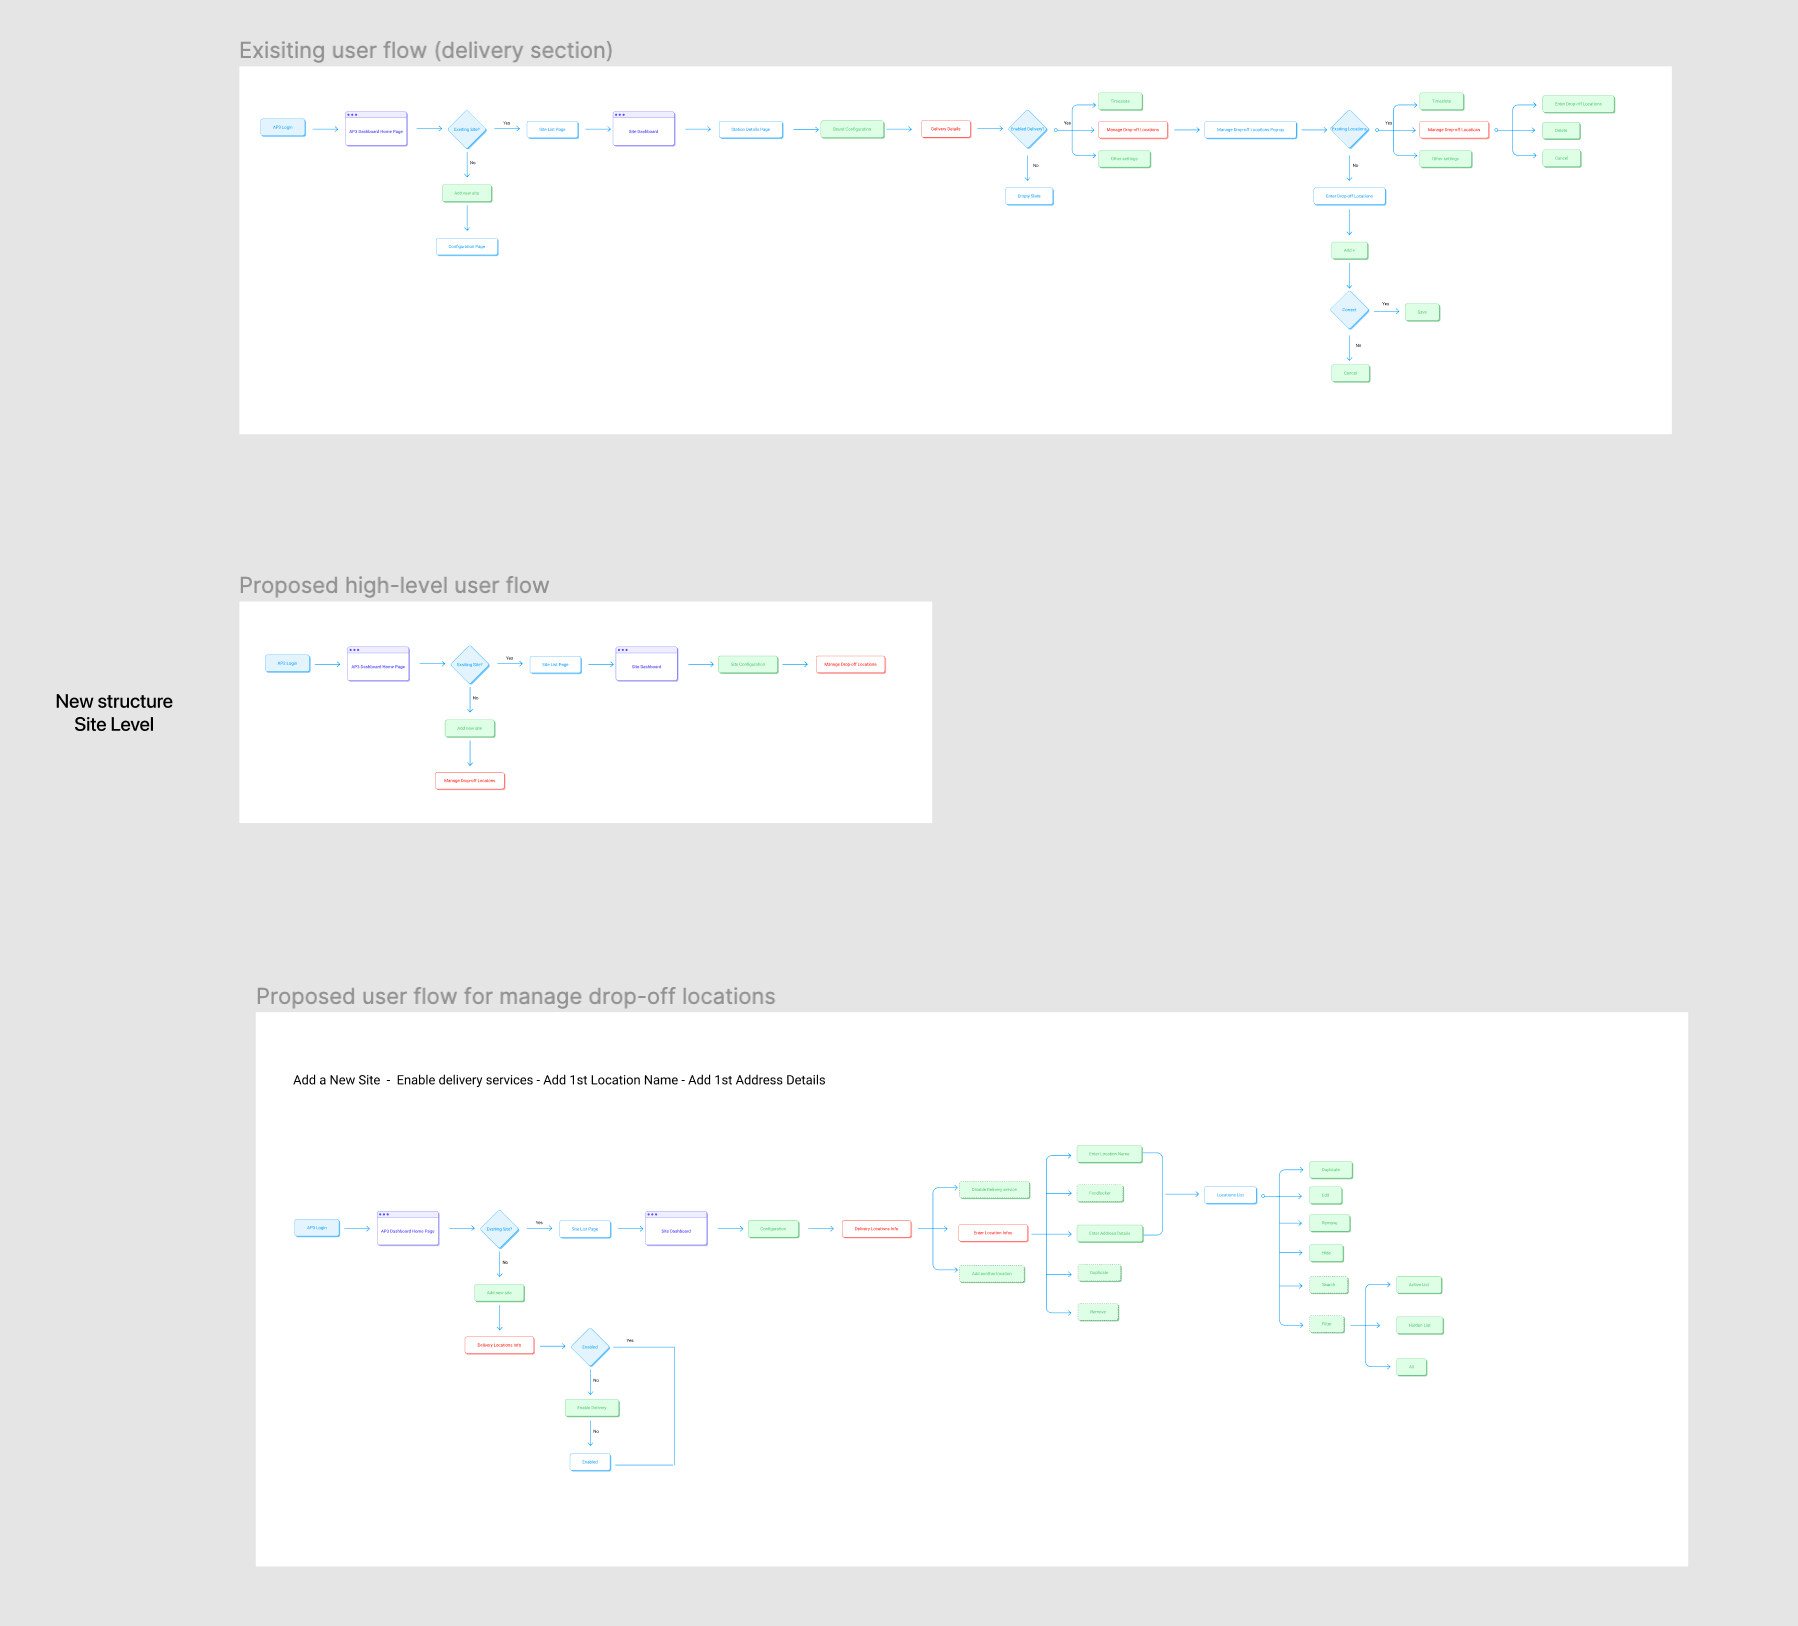
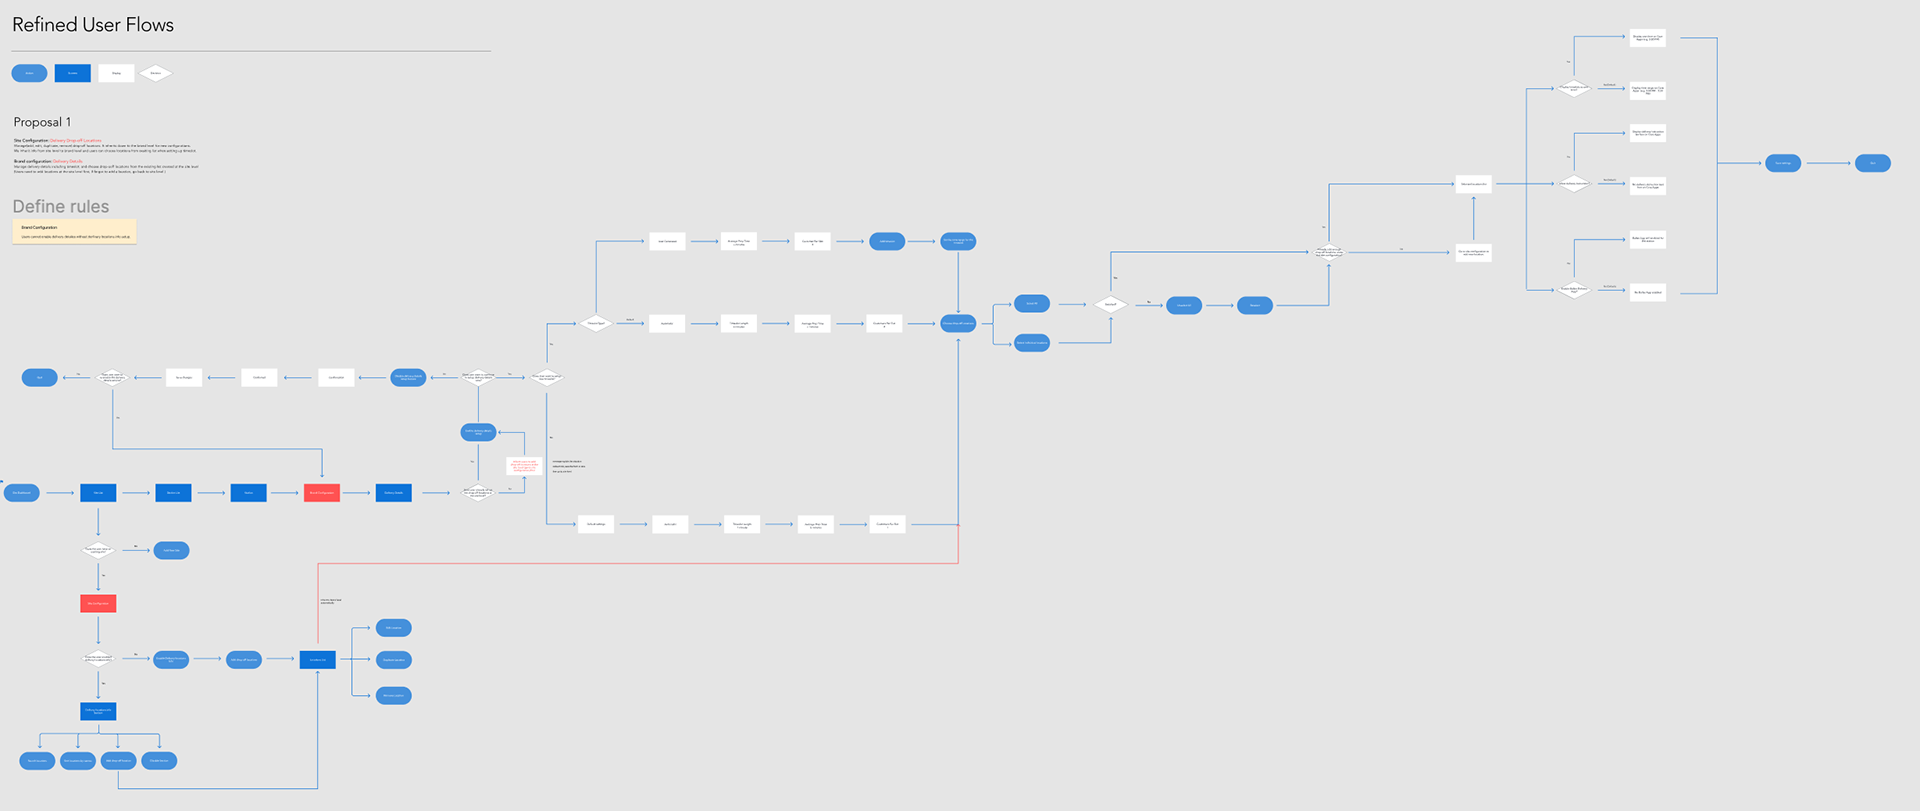
User Flow
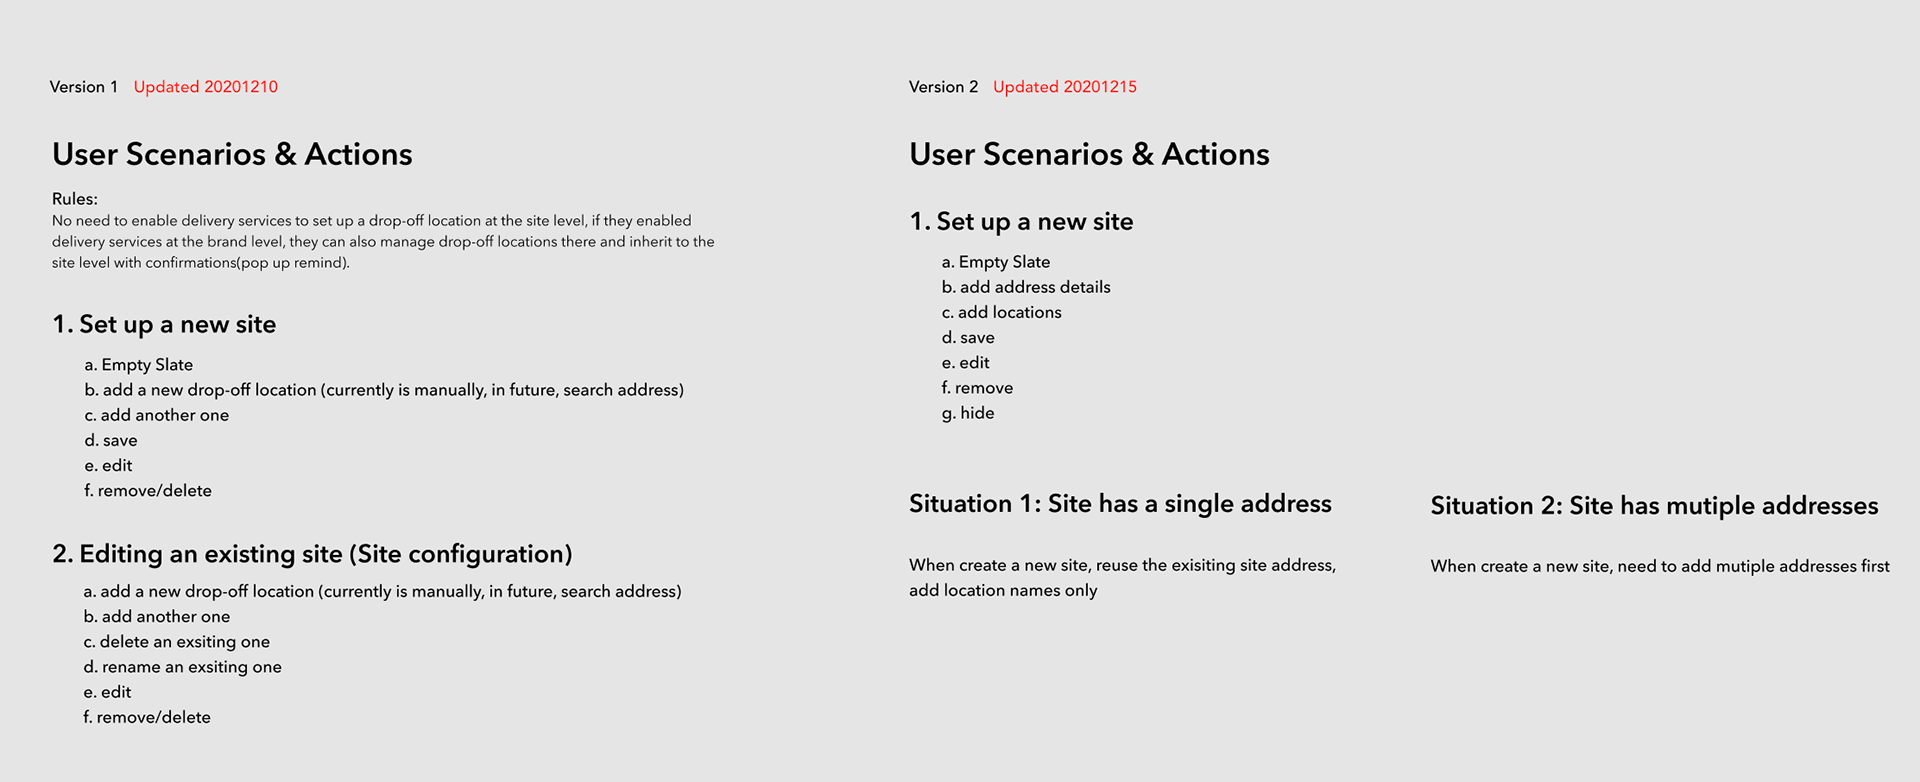
User Scenarios
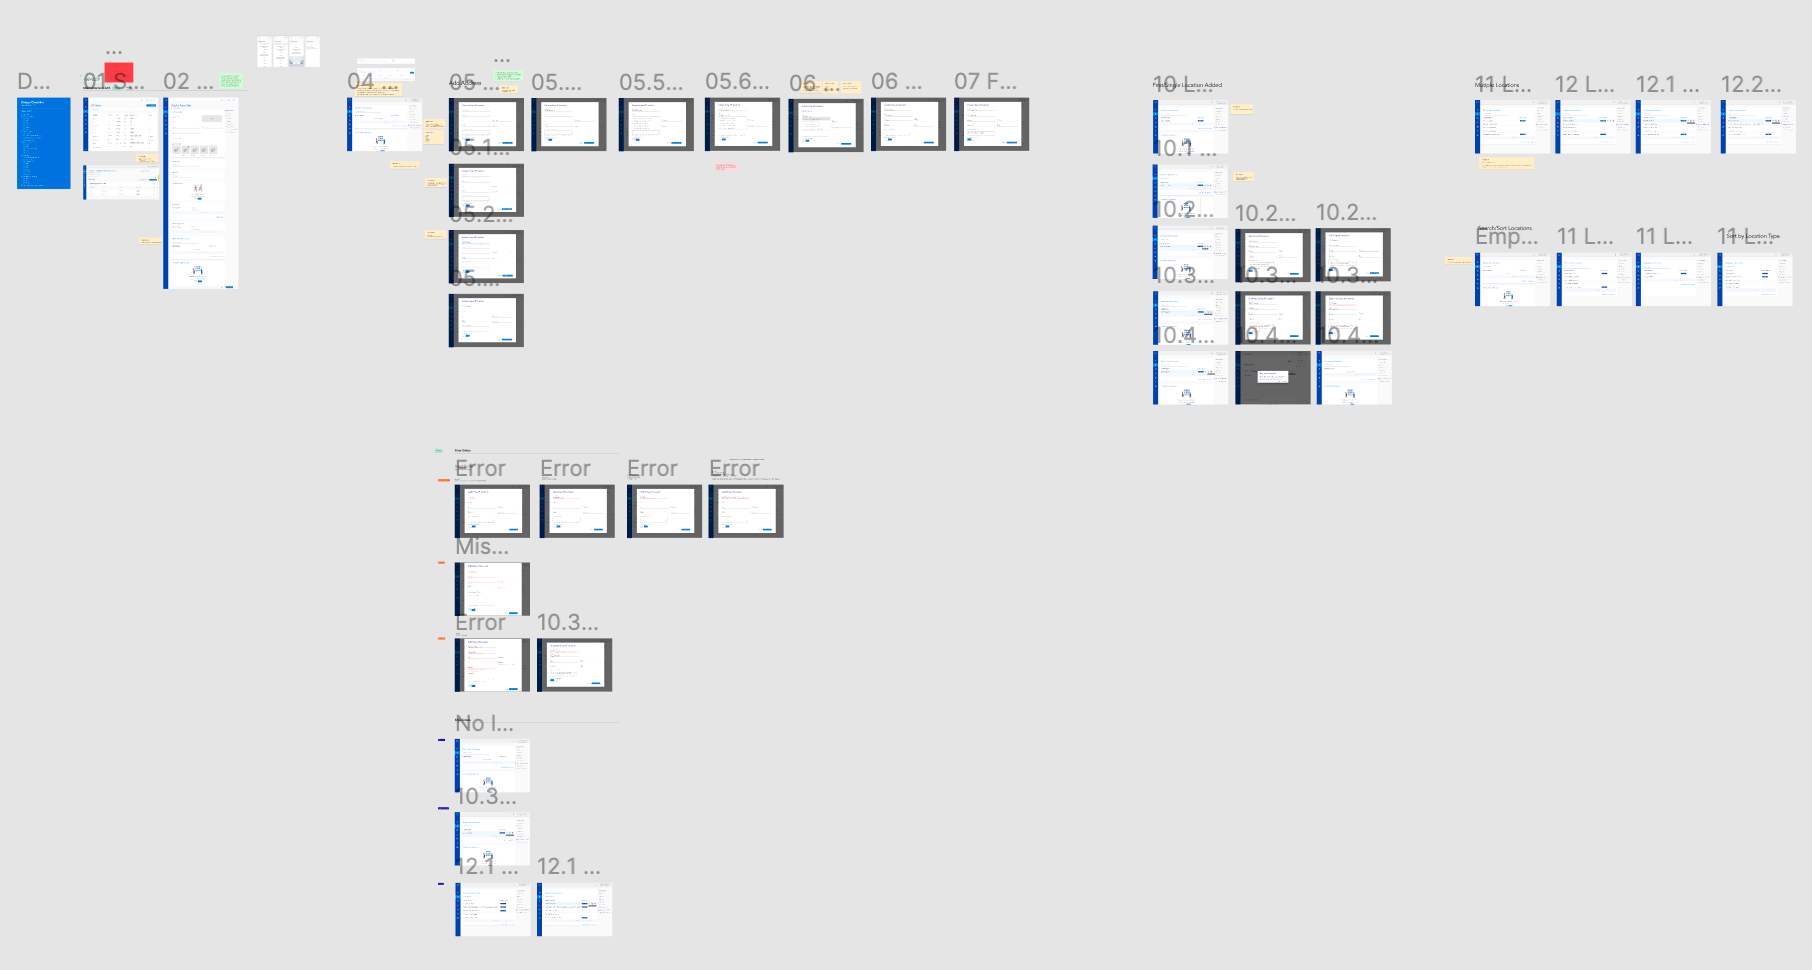
Design
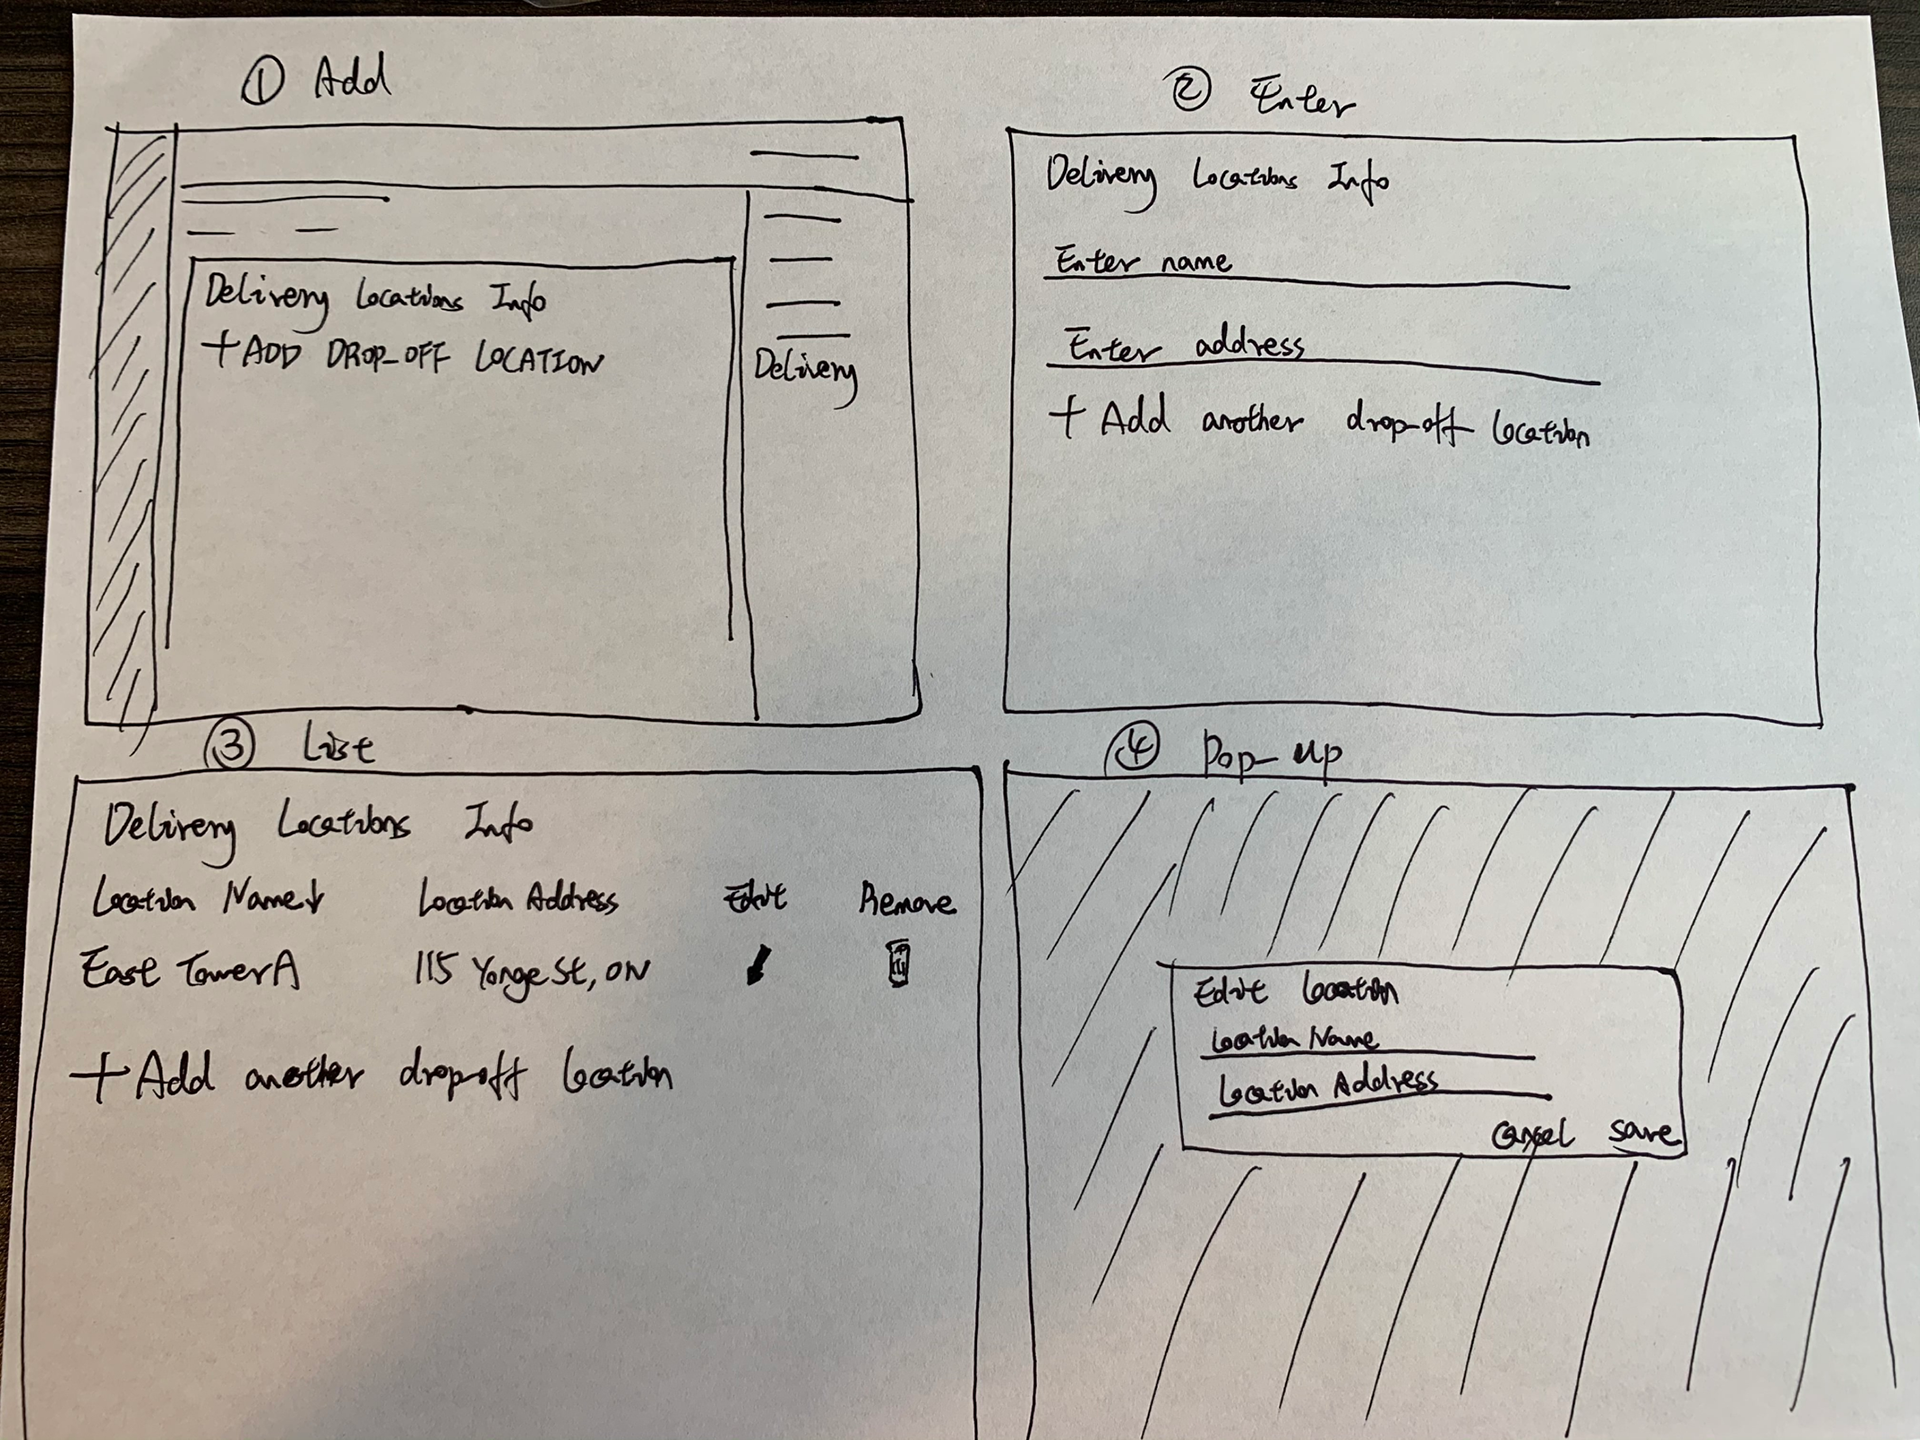
Sketches
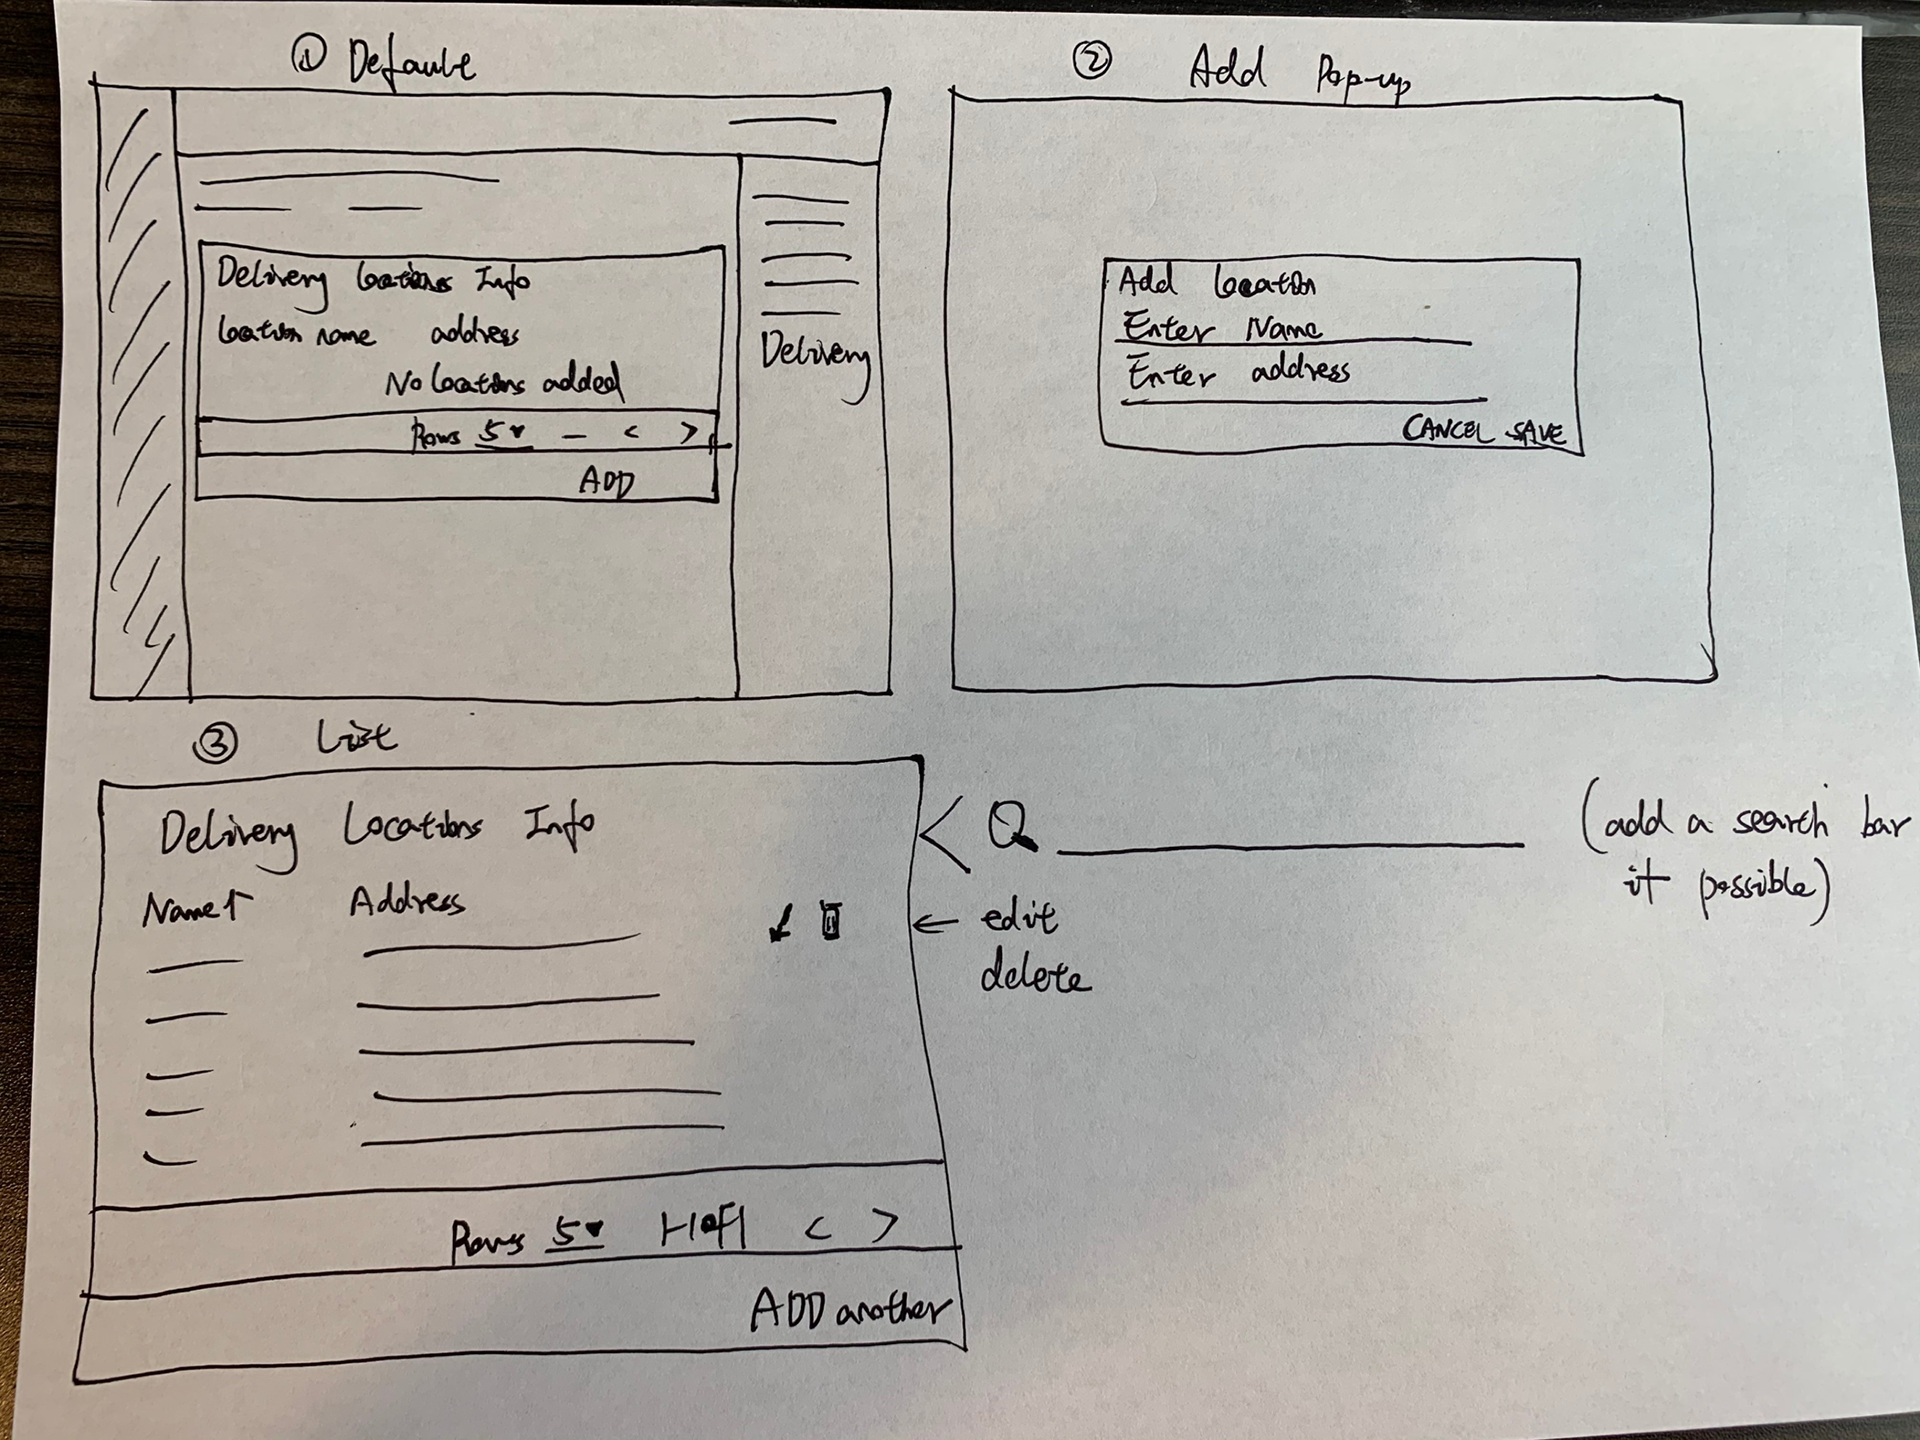
1st Low-Fi Wireframes
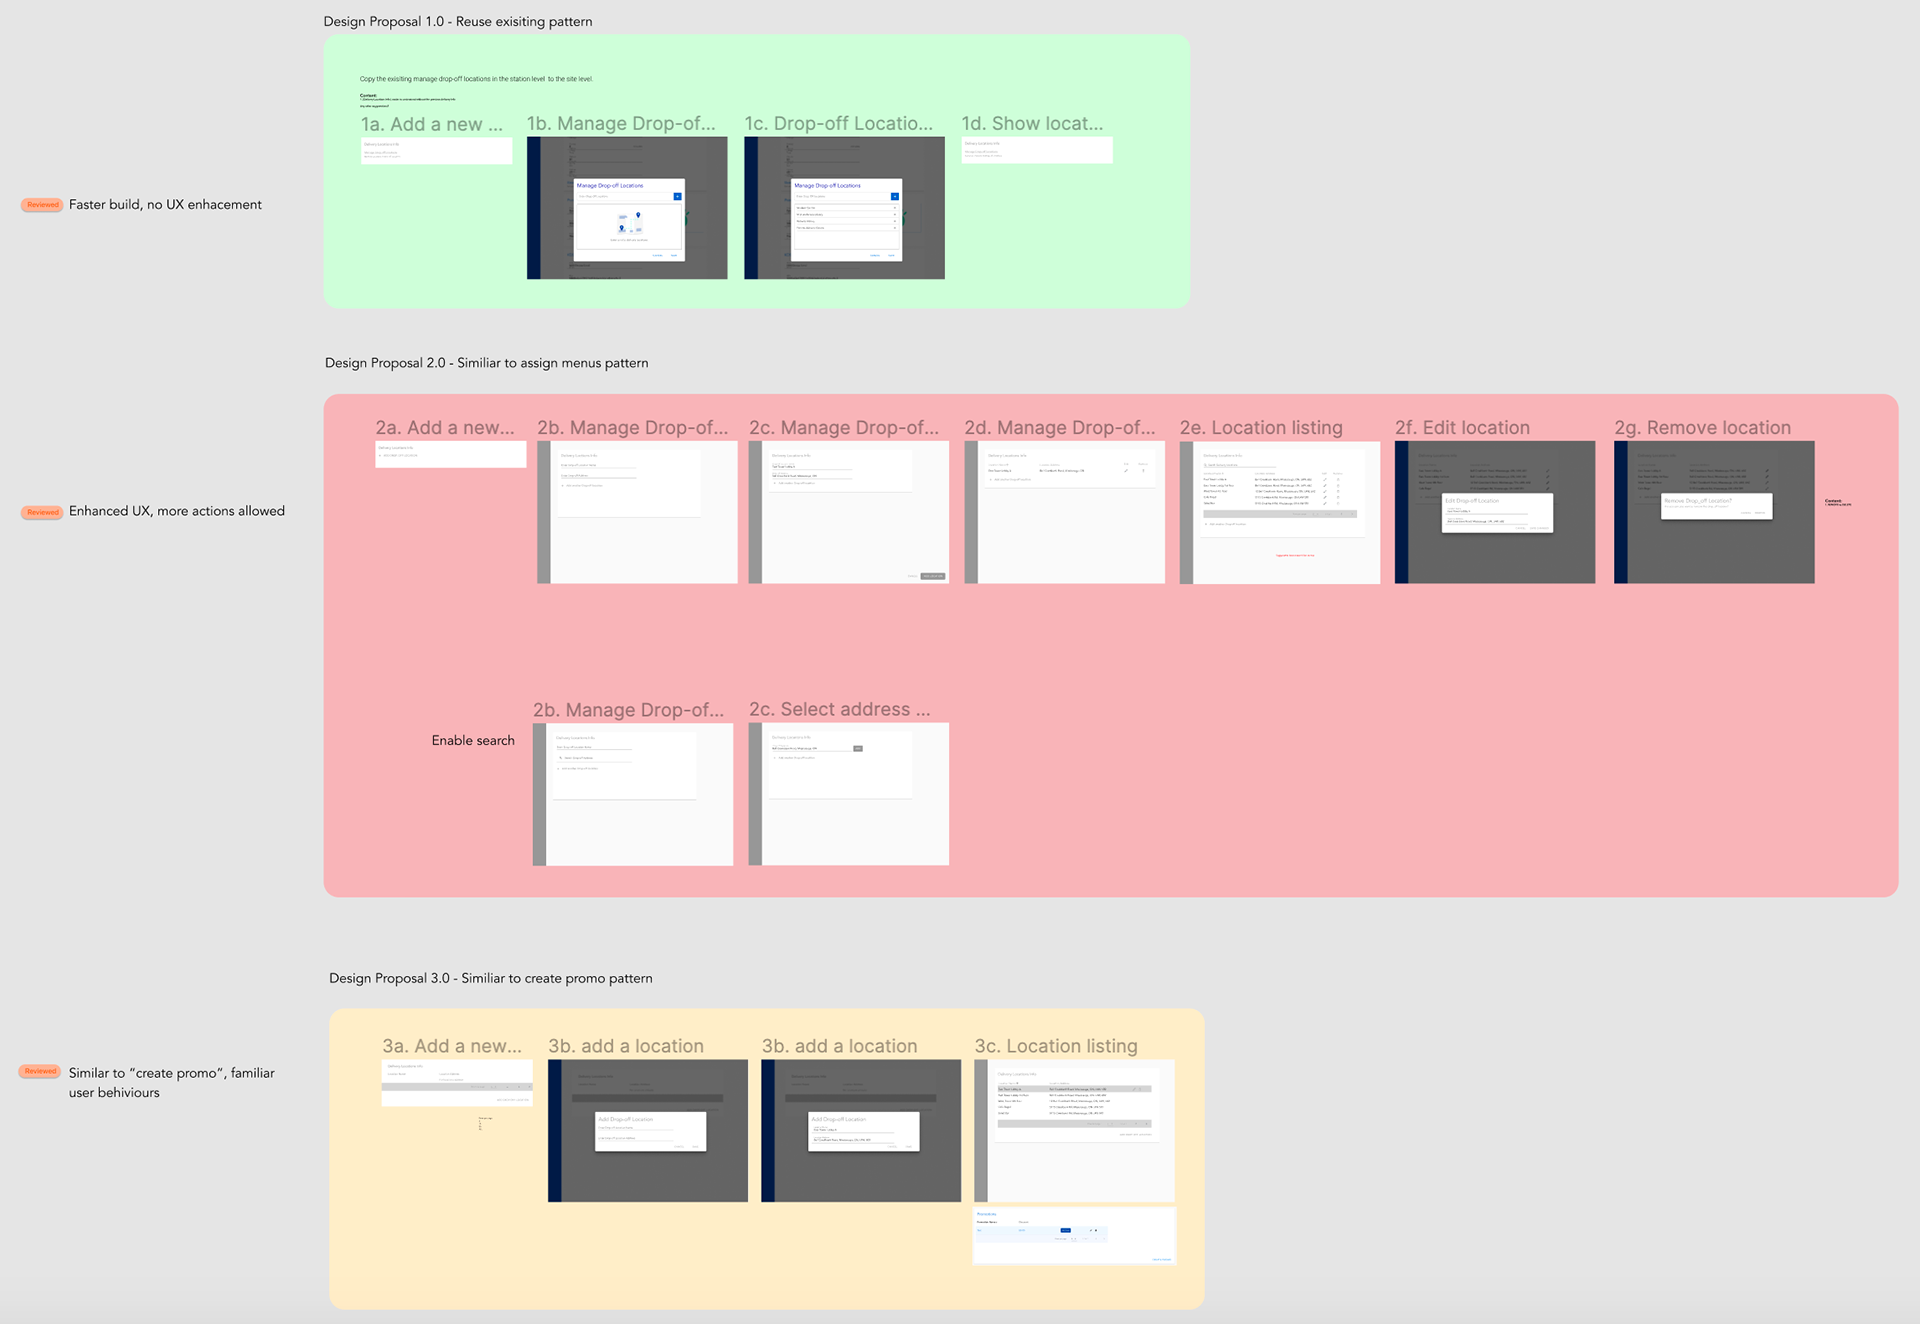
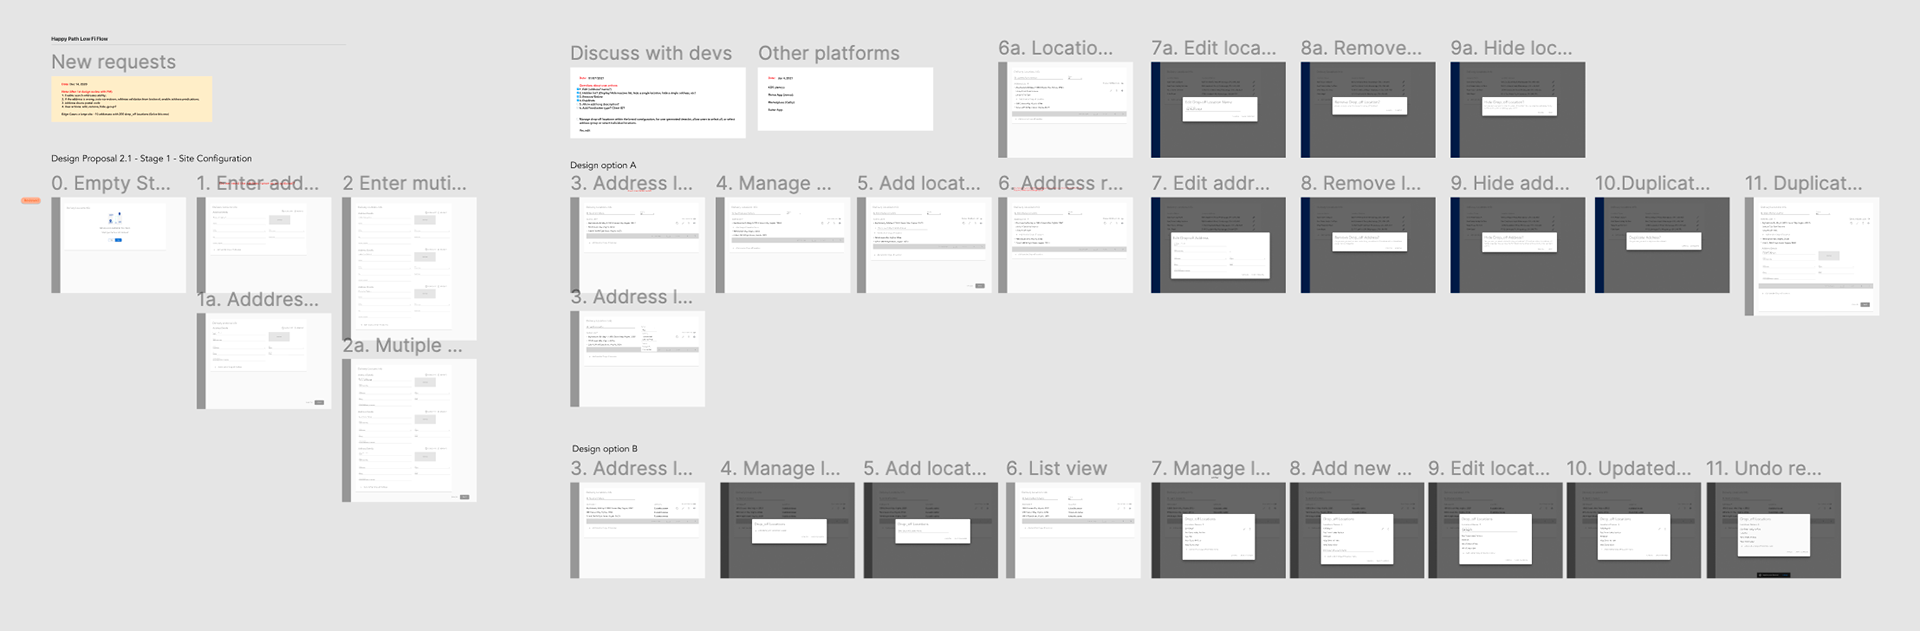
2nd Low-Fi Wireframes
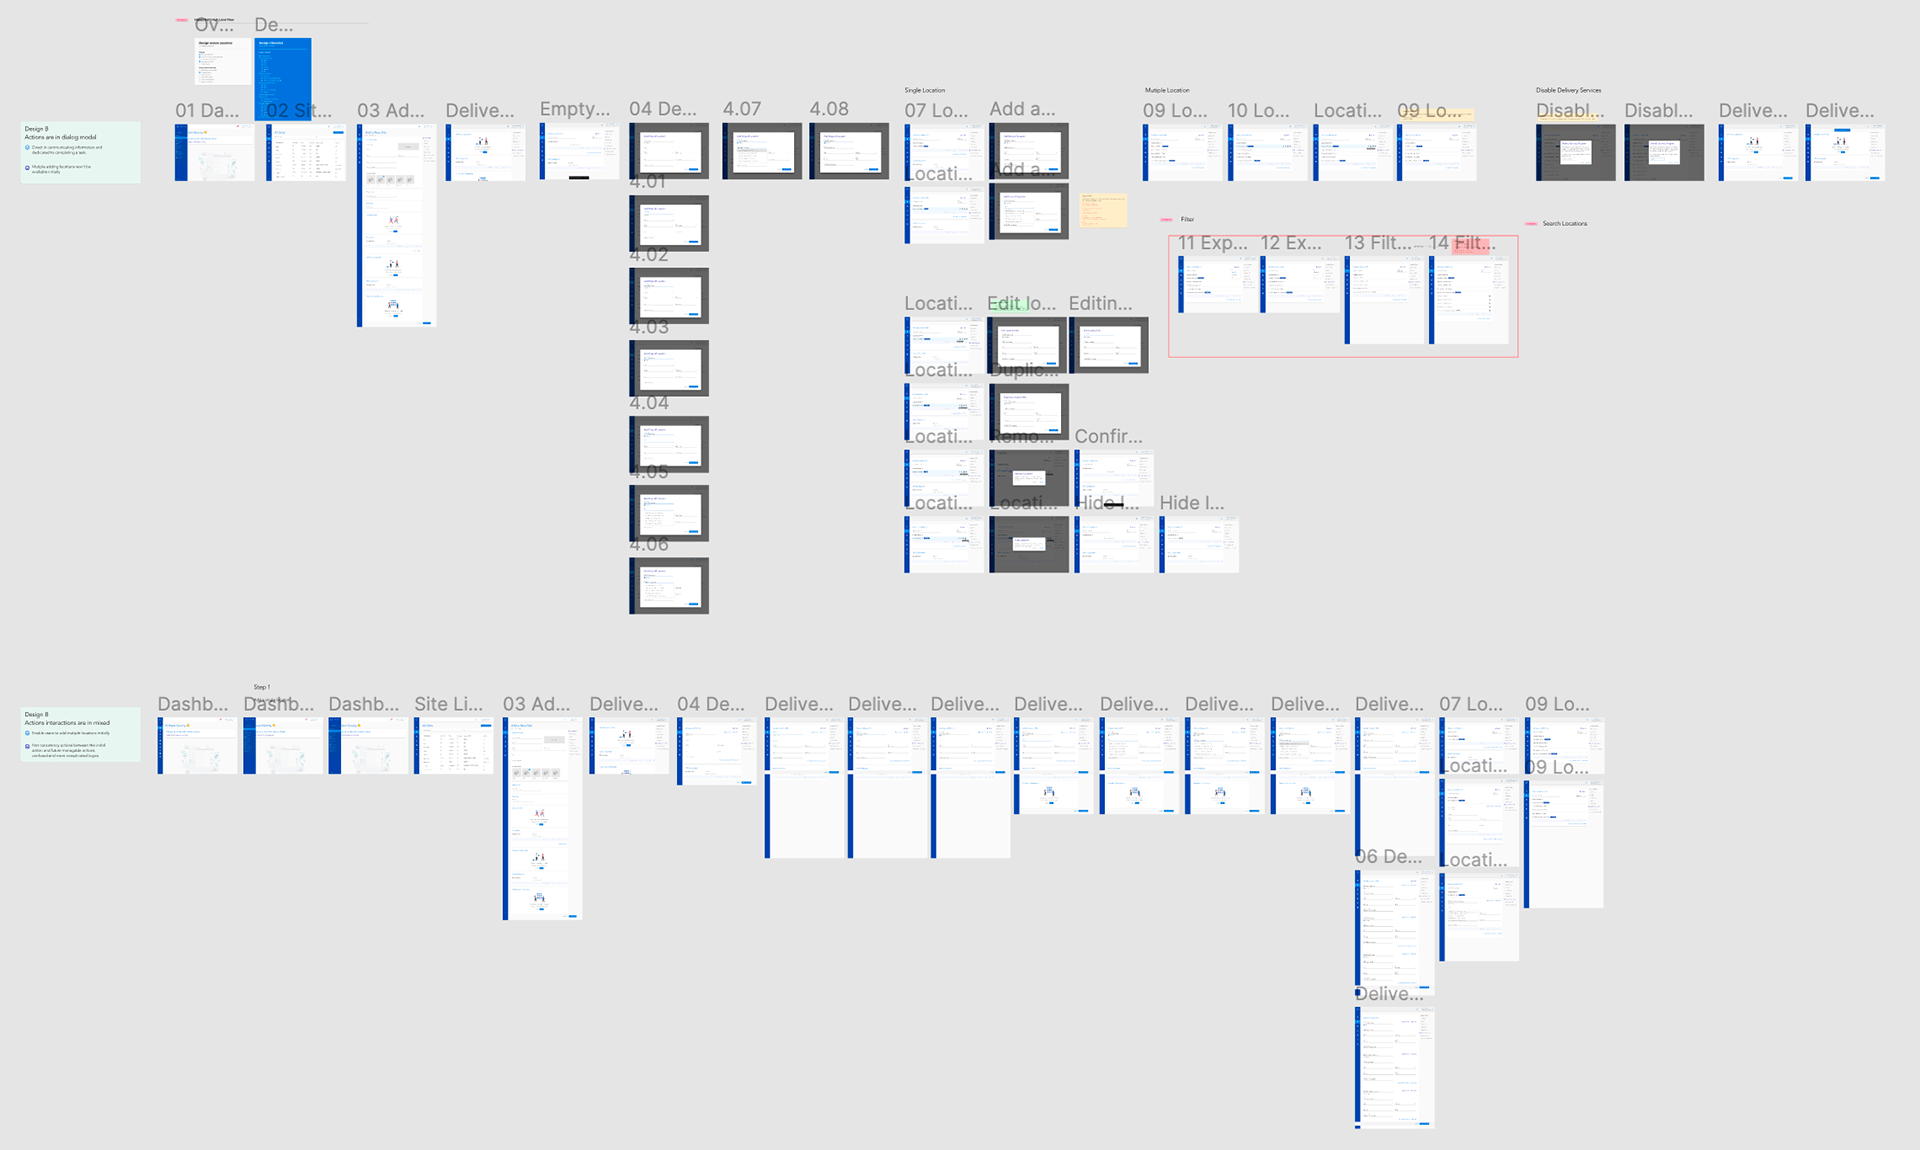
hi-fi Wireframes
A/B Testing
Scheduled 5 internal user testing sessions and together with UX Researcher conducted usability testings for two prototypes.

ui & Interaction Design
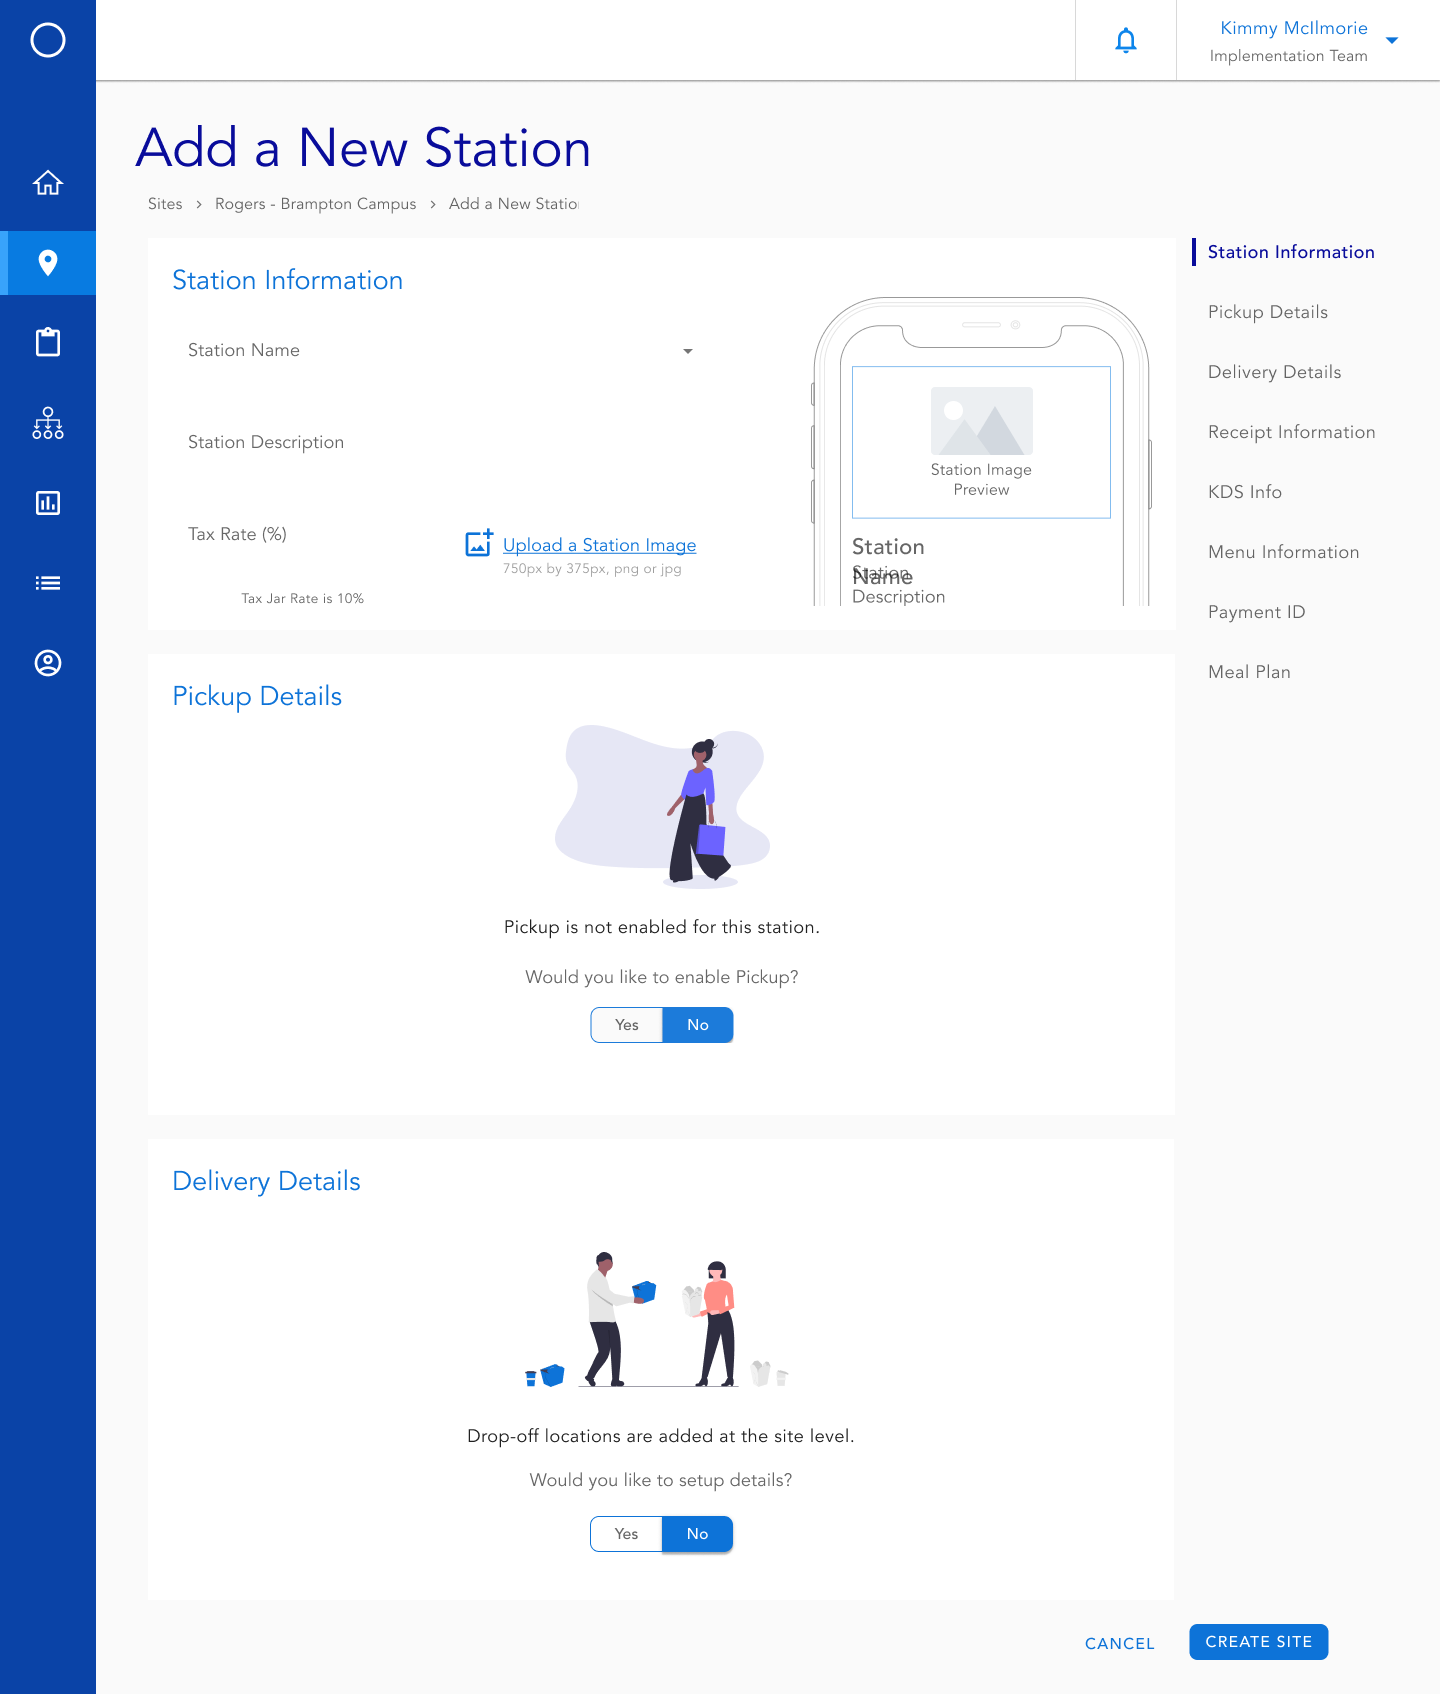
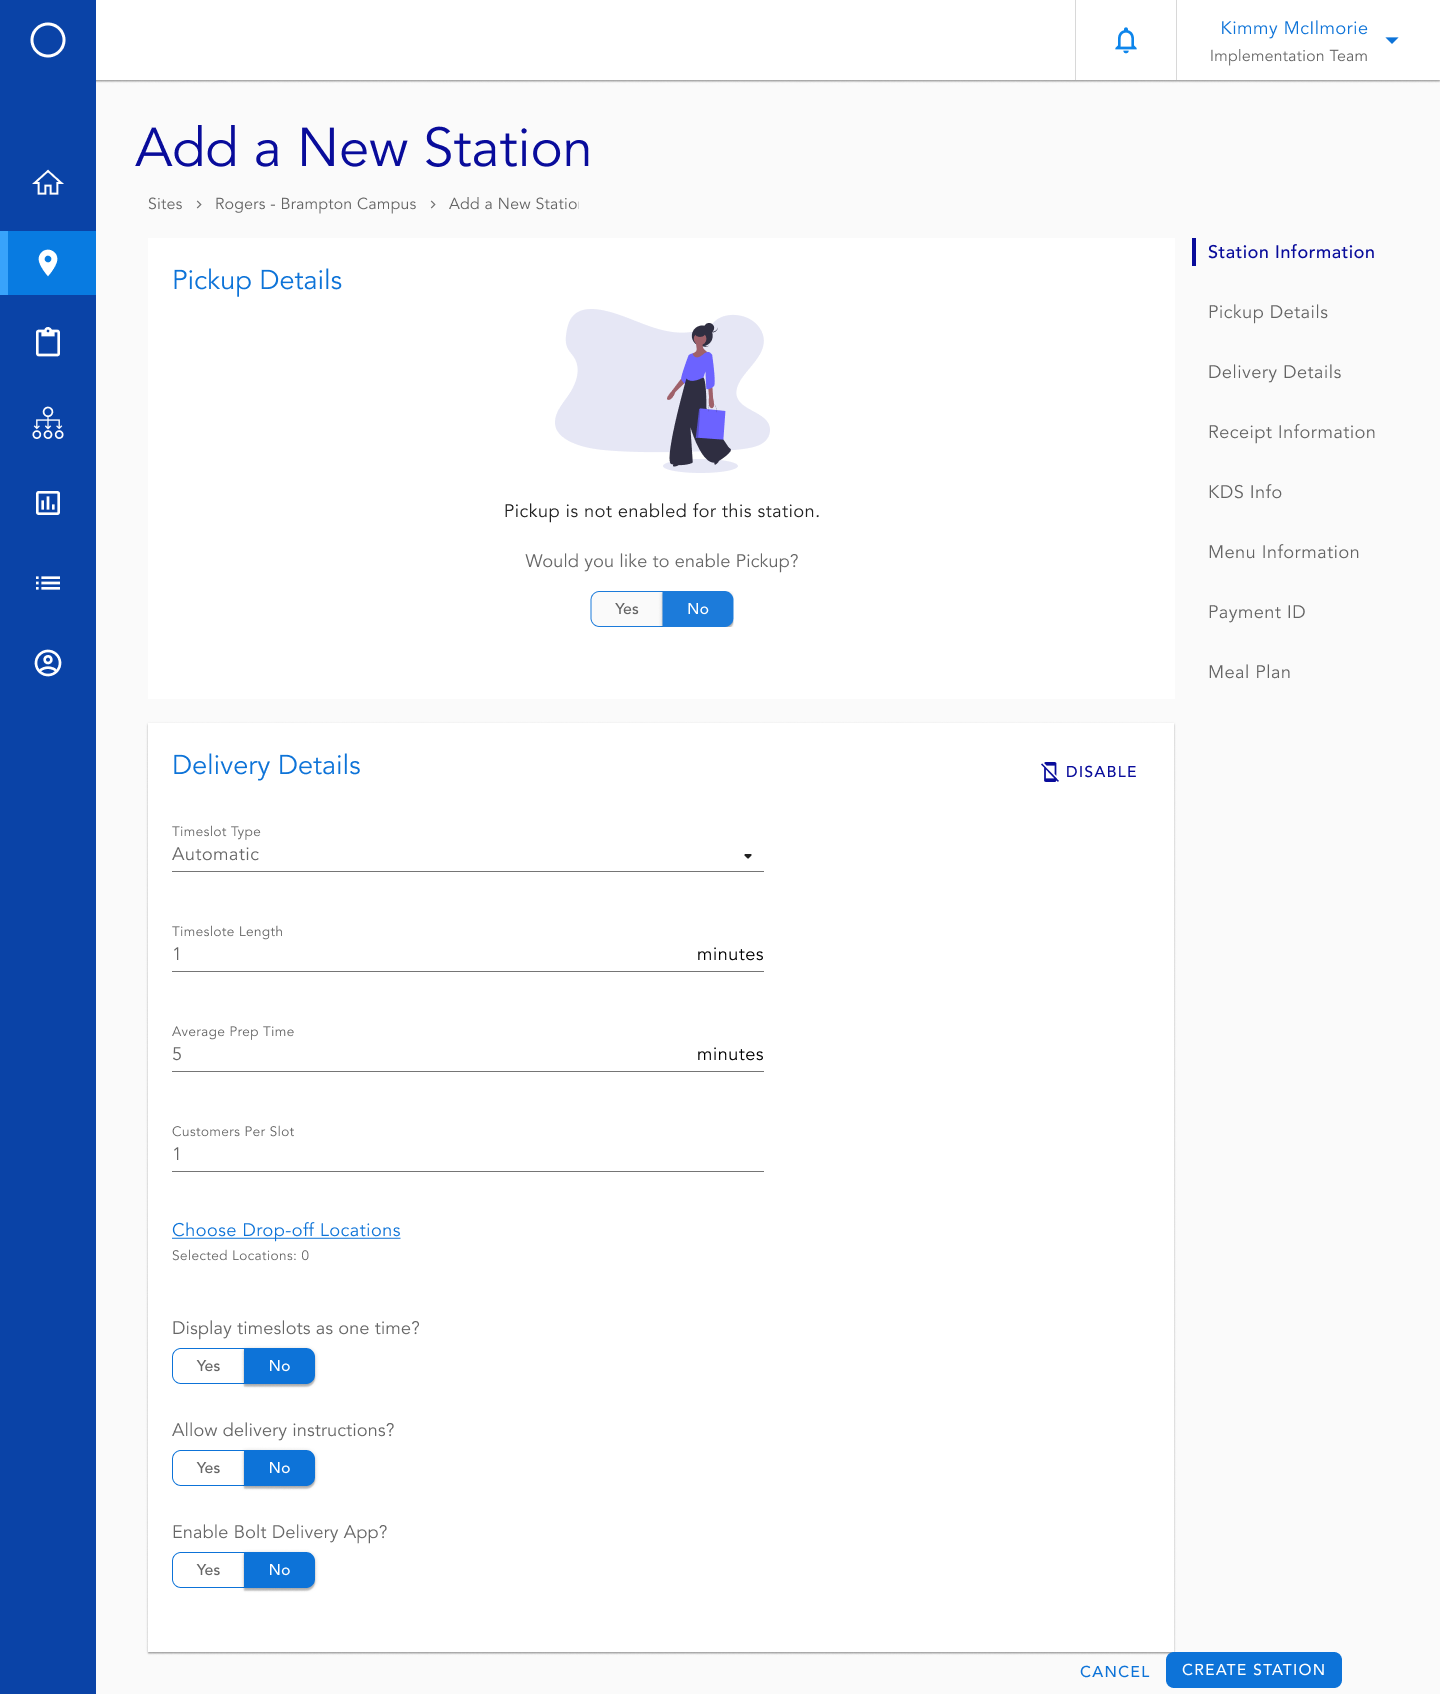
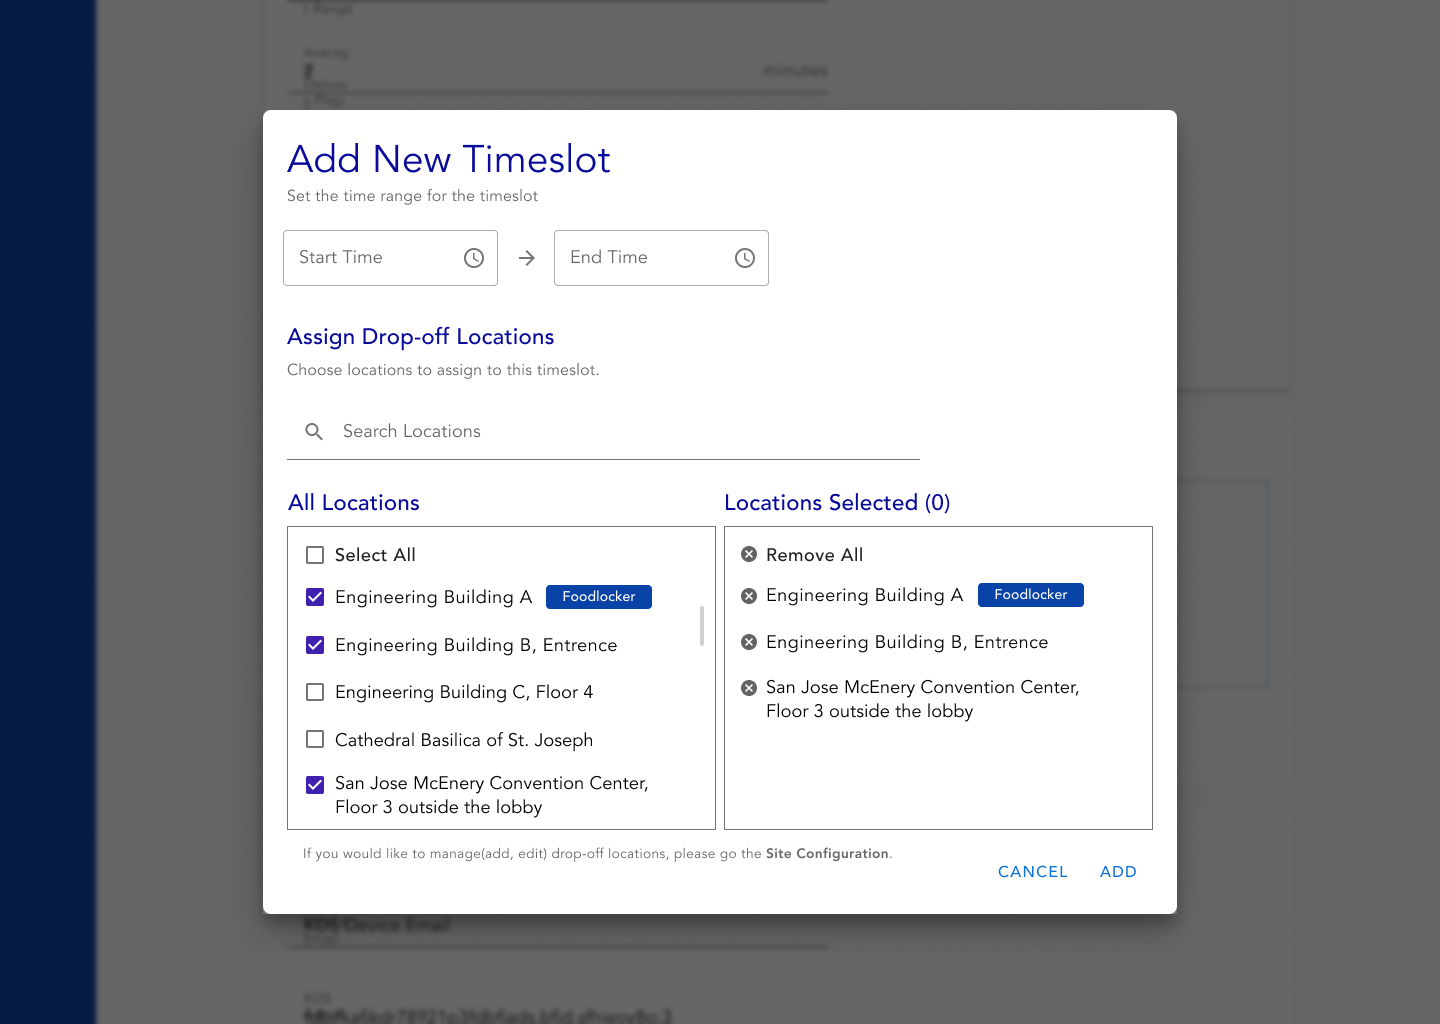
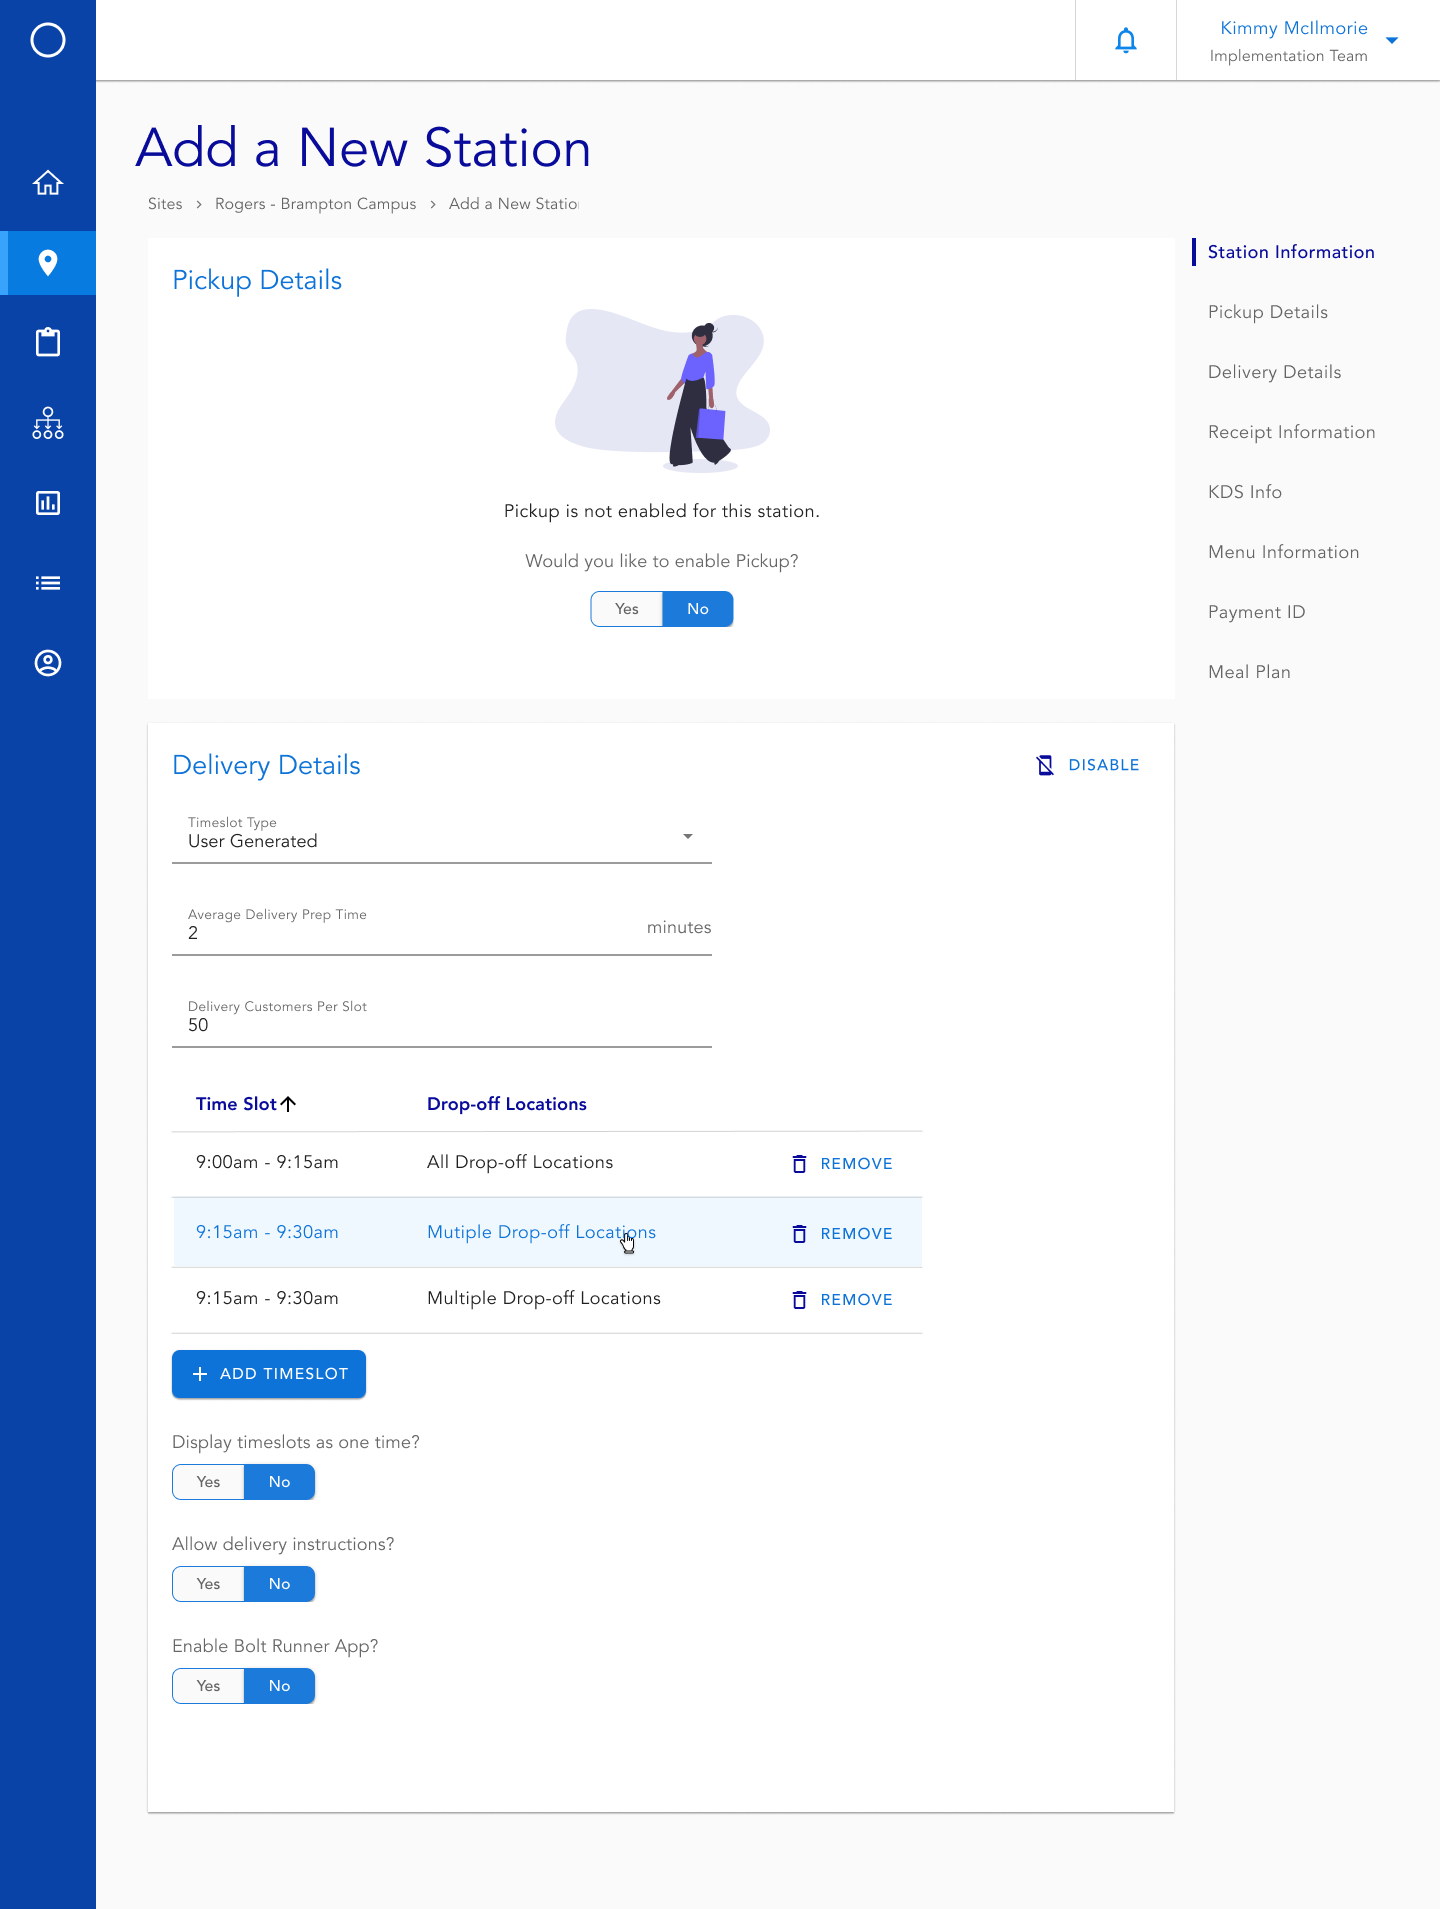
Main Screens
Site Configuration
Station Configuration
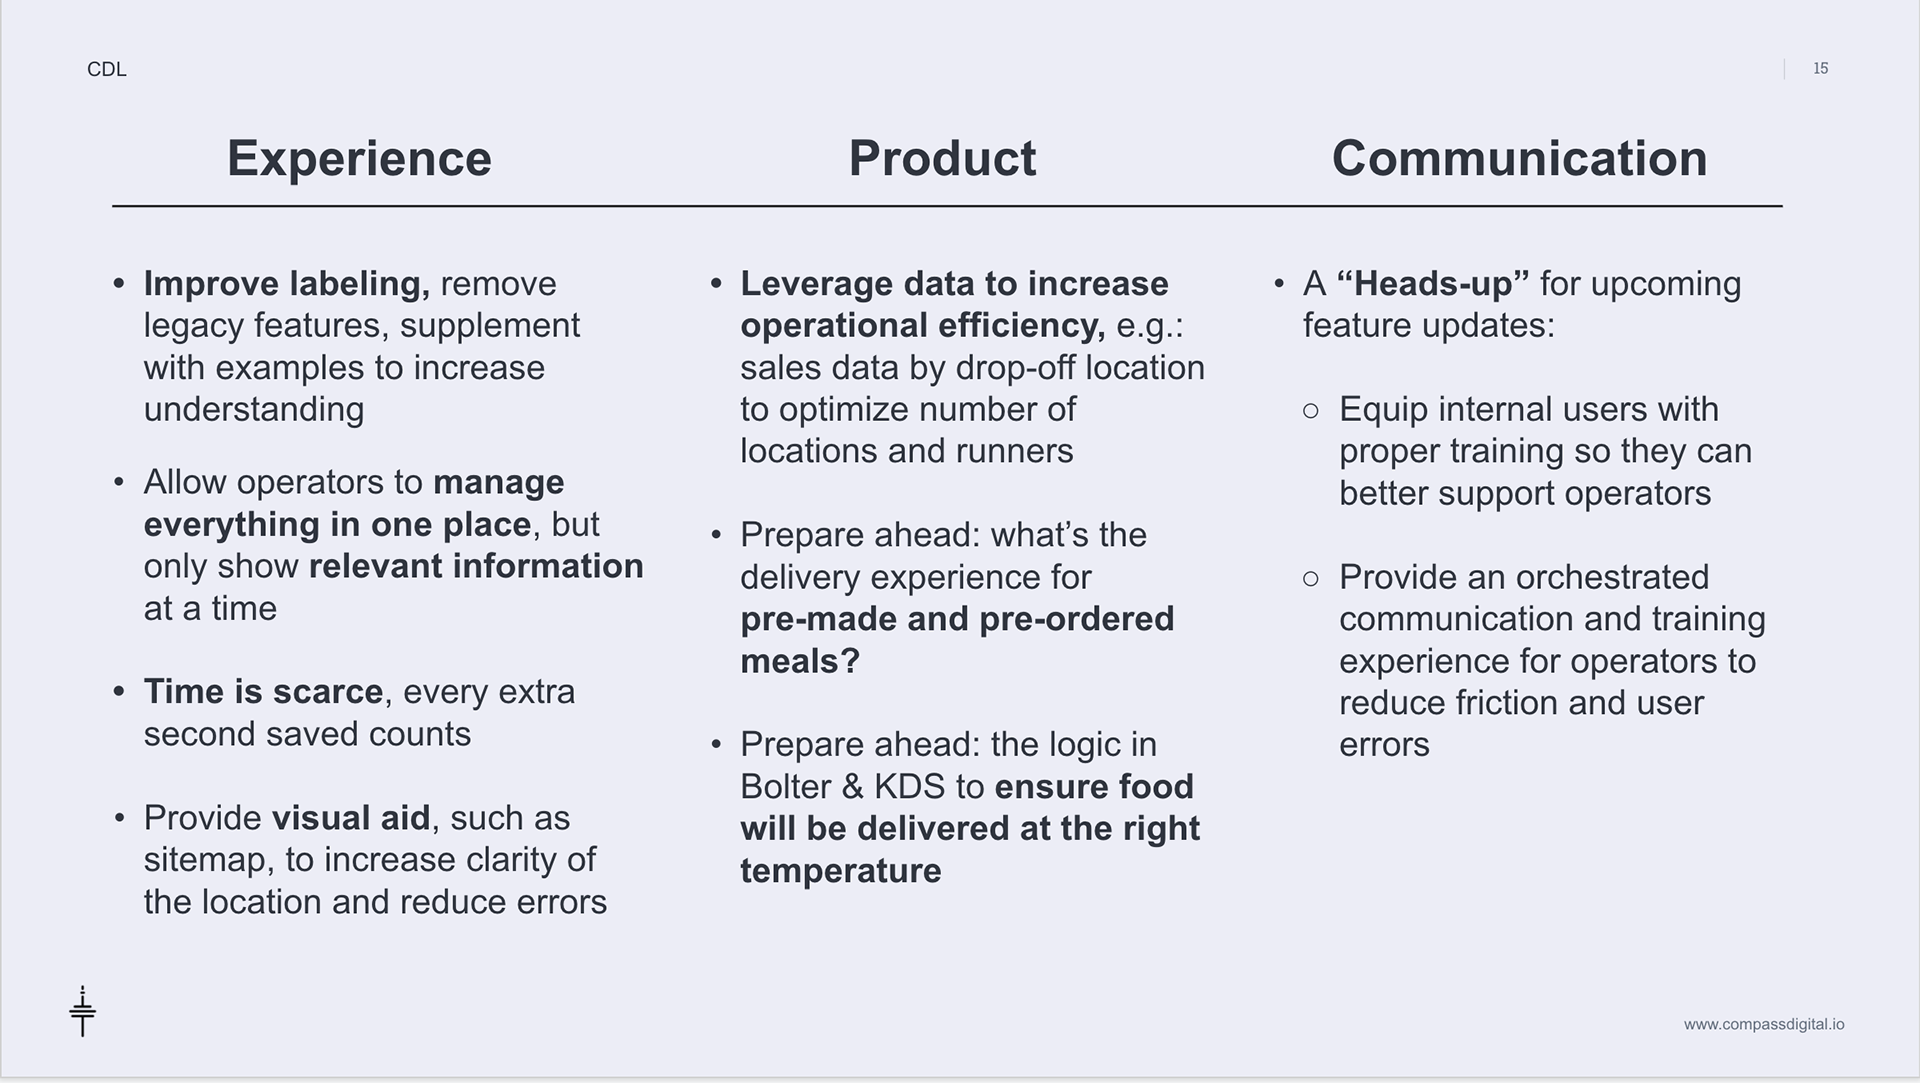
results
1. Unblocks third-party integrations API;
2. Reduces the amount of time spent setting up delivery for a new site, or modifying delivery configurations for an existing site;
3. Enables new features Marketplace Delivery;
4. Enables Integration with the autonomous delivery robot.
KPIs
1. Late Night Delivery drove 19% higher average check & optimized staff
2. Delivery accounted for 3% of all sales in Q2, up from 1% in Q1.
3. Q2 average check for delivery orders 69% higher than pick-up*
*$0 transactions removed
CASE STUDIES
Other connected parts